February 2016

Reverse Engineering with Correlated Features

February 11, 2016 | arthur charpentier

In econometric modeling, I usually have a problem with correlated features. A few weeks ago, I was discussing feature selection when features are correlated. This week, I was wondering about reverse engineering when features might be correlated (not to say very correlated). The way I see reverse engineering is the ...
[Read more...]

Clustering French Cities (based on Temperatures)

February 11, 2016 | arthur charpentier

In order to illustrate hierarchical clustering techniques and k-means, I did borrow François Husson‘s dataset, with monthly average temperature in several French cities. __ temp=read.table( + "http://freakonometrics.free.fr/FR_temp.txt", + header=TRUE,dec=",") We have 15 cities, with monthly observations __ X=temp[,1:12] __ boxplot(X) Since the ...
[Read more...]

Plot the new SVG R logo with ggplot2

February 11, 2016 | hrbrmstr

High resolution and SVG versions of the new R logo are finally available. I converted the SVG to WKT (file here) which means we can use it like we would a shapefile in R. That includes plotting! Here’s a short example of how to read that WKT and plot ...
[Read more...]

Demystifying the GLM (Part 1)

February 11, 2016 | Andrew Worsley

Upon being thrown a prickly binary classification problem, most data practitioners will have dug deep into their statistical tool box and pulled out the trusty logistic regression model. Essentially, logistic regression can help us predict a binary (yes/no) response with consideration given to other, hopefully related, variables. For example, ... [Read more...]

A Tall Drink of Water

February 10, 2016 | Julia Silge

In a previous post, I used water consumption data from Utah’s Open Data Catalog to explore what kind of users consume the most water in my home here in Salt Lake City, what the annual pattern of water use is, and how the drought of the past few years ... [Read more...]

Finding the K in K-means by Parametric Bootstrap

February 10, 2016 | Nina Zumel

One of the trickier tasks in clustering is determining the appropriate number of clusters. Domain-specific knowledge is always best, when you have it, but there are a number of heuristics for getting at the likely number of clusters in your data. We cover a few of them in Chapter 8 (available ...
[Read more...]

In case you missed it: January 2016 roundup

February 10, 2016 | David Smith

In case you missed them, here are some articles from January of particular interest to R users. Animated visualizations and analysis of data from NYC's municipal bike program, created with R. Many local R user groups are sharing materials from meetups using Github. A detailed R tutorial on analyzing your ... [Read more...]

Analysis: Clinton backed by Big Money: Sanders by Small

February 10, 2016 | Francis Smart

This article examines FEC data in depth and finds what most people already know. Hillary Clinton's presidential bid is financed largely through a relatively small quantity of big donors while Bernie Sanders' presidential bid is funded by numerous small donors.In order to do our analysis, we look at four ...
[Read more...]

Craft httr calls cleverly with curlconverter

February 10, 2016 | hrbrmstr

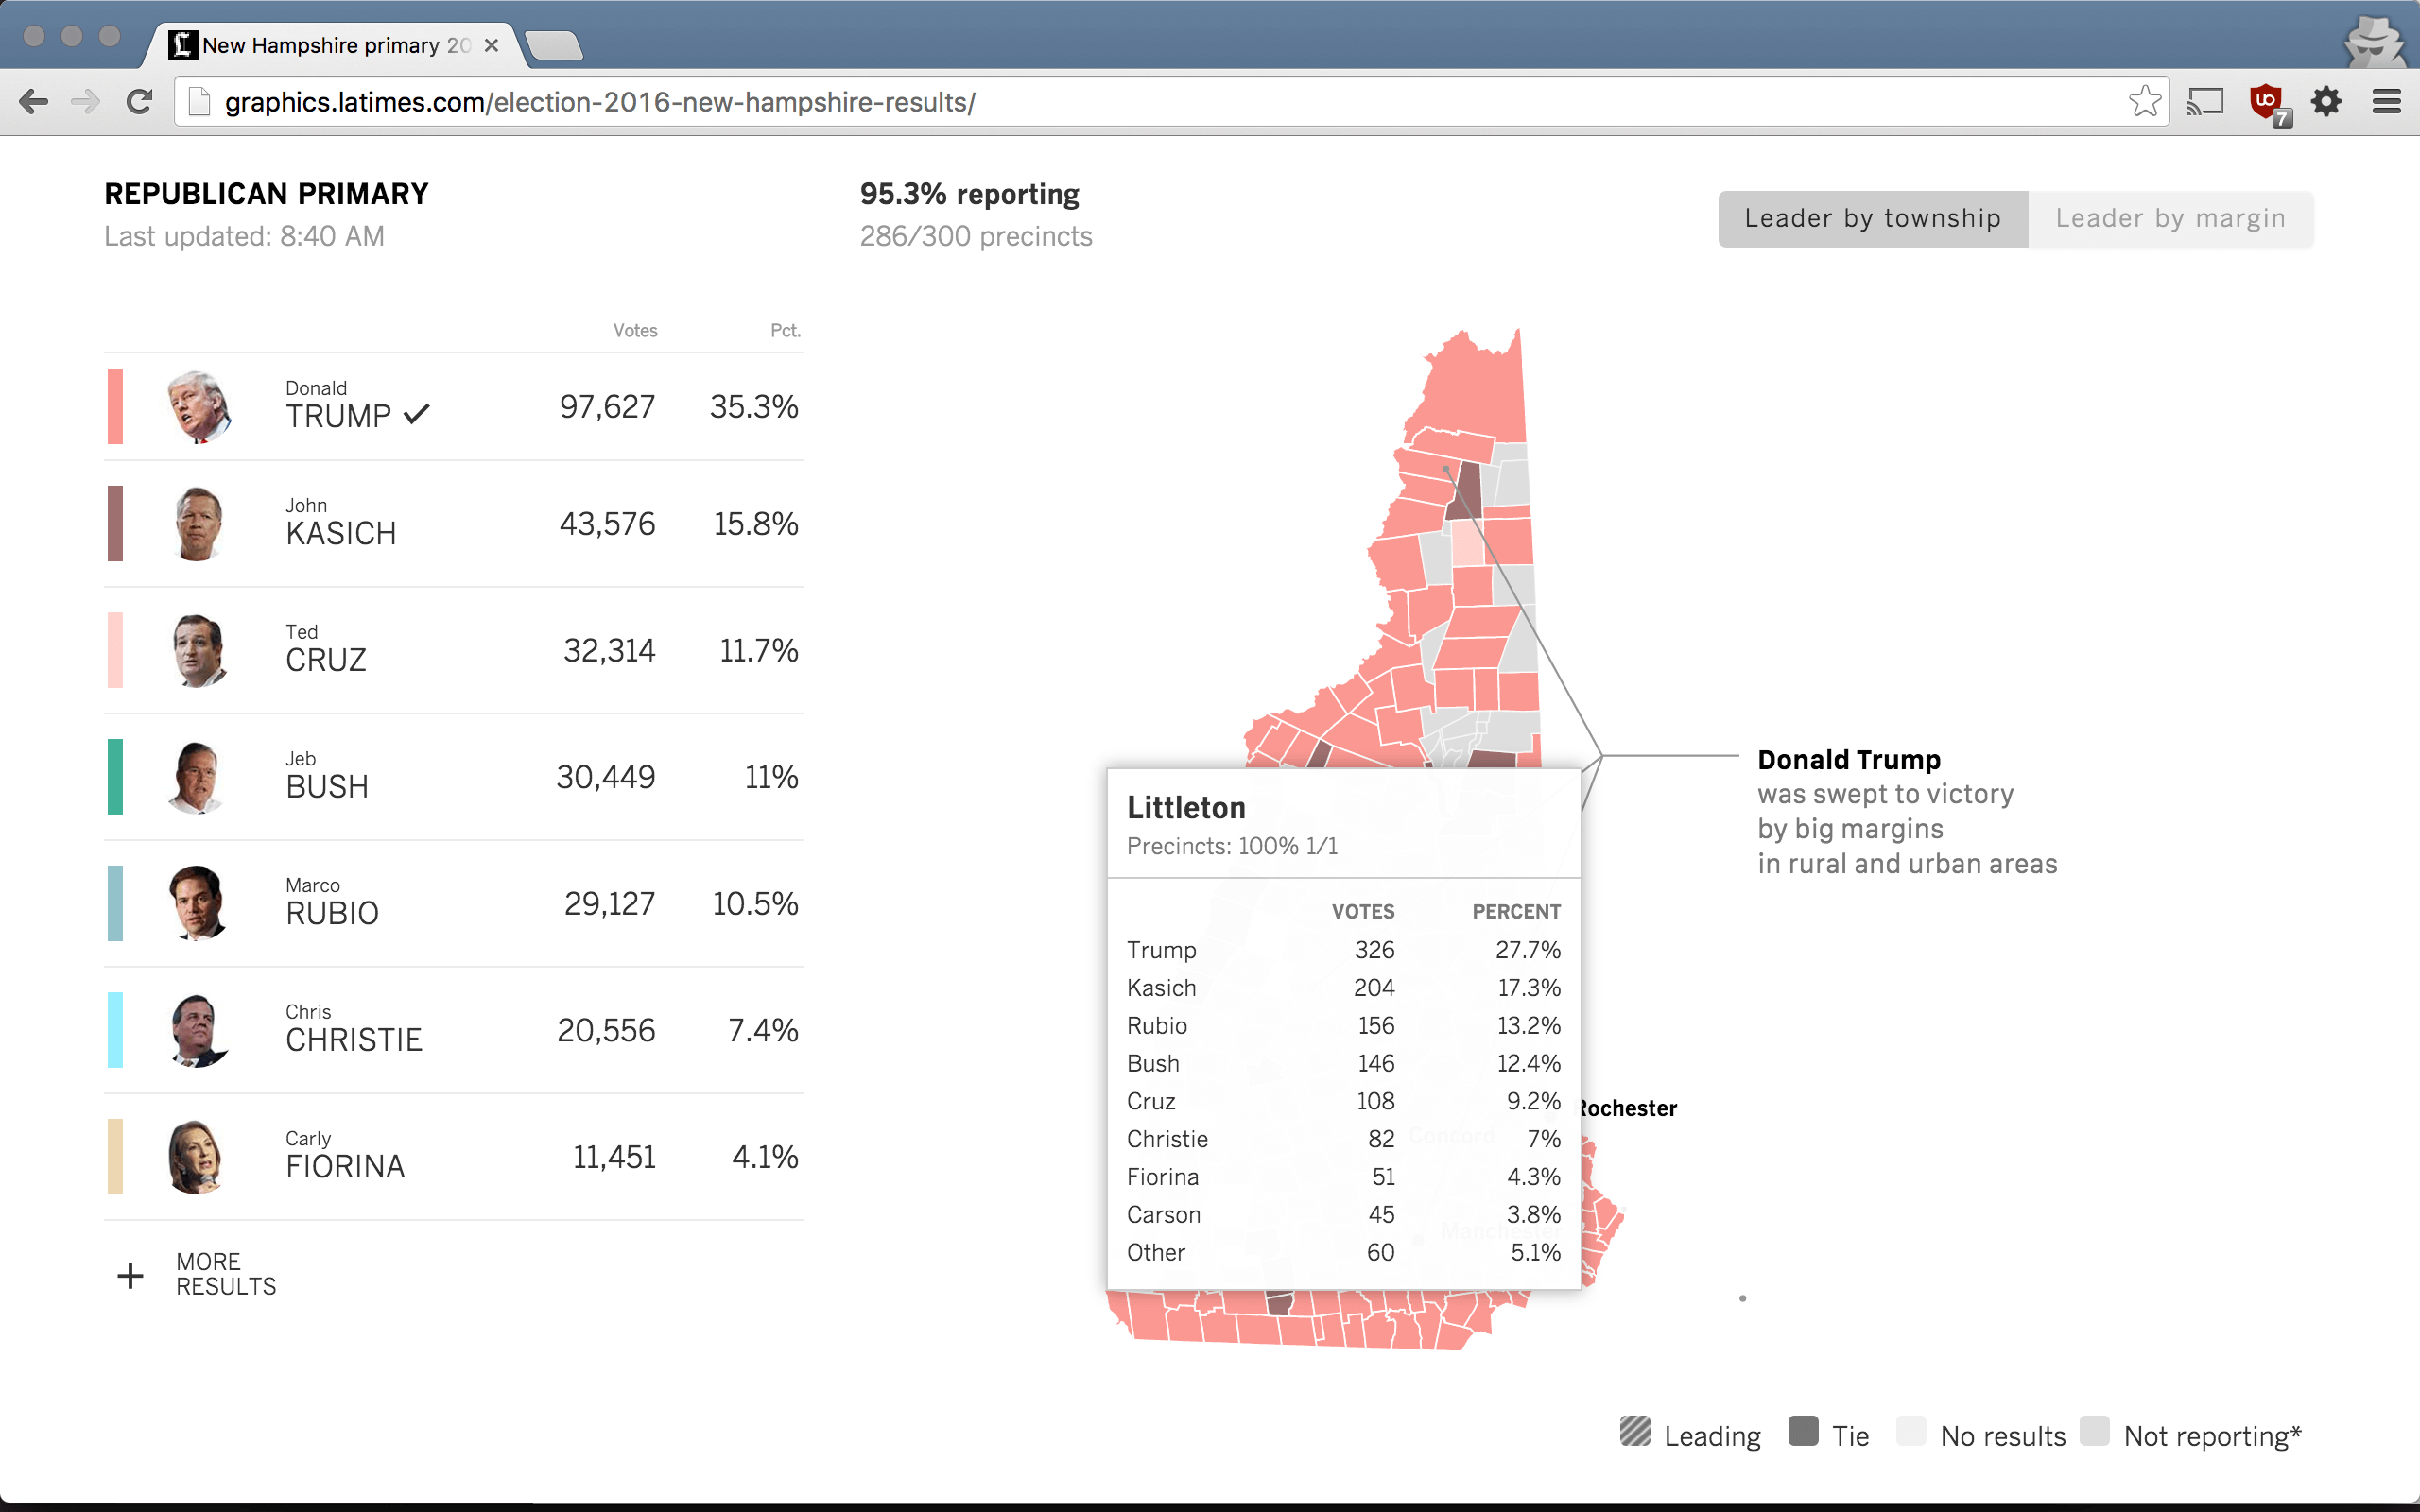
When you visit a site like the LA Times’ NH Primary Live Results site and wish you had the data that they used to make the tables & visualizations on the site: Sometimes it’s as simple as opening up your browsers “Developer Tools” console and looking for XHR (XML HTTP ...
[Read more...]

The Easiest Way to Learn ggplot2

February 10, 2016 | DataCamp Blog

Learn how to produce meaningful and beautiful data visualizations with DataCamp’s ggplot2 course series. Be introduced to the principles of good visualizations and the grammar of graphics plotting concept implemented in the ggplot2 package. Learn yourself how to make complex exploratory plots, and be able to make a custom ... [Read more...]

Clusters of Texts

February 10, 2016 | arthur charpentier

Another popular application of classification techniques is on texmining (see e.g. an old post on French president speaches). Consider the following example,  inspired by Nobert Ryciak’s post, with 12 wikipedia pages, on various topics, __ library(tm) __ library(stringi) __ library(proxy) __ titles = c("Boosting_(machine_learning)", + "Random_forest", + "K-nearest_neighbors_...
[Read more...]

Clusters of (French) Regions

February 9, 2016 | arthur charpentier

For the data scienec course of tomorrow, I just wanted to post some functions to illustrate cluster analysis. Consider the dataset of the French 2012 elections __ elections2012=read.table( "http://freakonometrics.free.fr/elections_2012_T1.csv",sep=";",dec=",",header=TRUE) __ voix=which(substr(names( + elections2012),1,11)=="X..Voix.Exp") __ elections2012=elections2012[1:96,] __ X=...
[Read more...]

An Introduction to Time Series with JSON Data

February 9, 2016 | Divya Parmar

For this post, I wanted to take the data analysis process in a different direction. Normally, an R analysis starts with data from a comma-separated Excel file (.csv) or a tab-separated file (.txt). However, online data is often formatted in JSON, which stands for JavaScript Online Notation. JSON has different ... [Read more...]
1 7 8 9 10 11 14

Never miss an update!
Subscribe to R-bloggers to receive
e-mails with the latest R posts.
(You will not see this message again.)

Click here to close (This popup will not appear again)