2015

Non-linear growth curves with Stan

October 27, 2015 | R on mages' blog

I suppose the go to tool for fitting non-linear models in R is nls of the stats package. In this post I will show an alternative approach with Stan/RStan, as illustrated in the example, Dugongs: “nonlinear growth curve”, that is part of Stan’s documentation. The original example itself ... [Read more...]

Non-linear growth curves with Stan

October 27, 2015 | Markus Gesmann

I suppose the go to tool for fitting non-linear models in R is nls of the stats package. In this post I will show an alternative approach with Stan/RStan, as illustrated in the example, Dugongs: "nonlinear growth curve", that is part of Stan's documentation. The original example itself is ... [Read more...]

Think Bayes: Bayesian Statistics Made Simple

October 26, 2015 | xi'an

By some piece of luck, I came upon the book Think Bayes: Bayesian Statistics Made Simple, written by Allen B. Downey and published by Green Tea Press [which I could relate to No Starch Press, focussing on coffee!, which published Statistics Done Wrong that I reviewed a while ago] which ...
[Read more...]

Has the S&P 500 Cleared the Earlier Sell?

October 25, 2015 | quintuitive

Life has been busy and has kept me away from blogging, and from trading, mostly. Still, I can’t stay away from monitoring the markets, and, with the recent rally, I started asking myself – has the situation changed since the 200 day SMA signaled an exit. What do you think – make ... [Read more...]

House Effects in Argentinian polling

October 24, 2015 | » R

I’ve already posted on “house effects”, the tendency of polling organizations to systematically vary in their results from one another. In this post, I look specifically at these house effects, and show which polling organisations over or under-estimate support for each candidate–compared to the average–in this presidential ...
[Read more...]

rfoaas 0.1.8

October 24, 2015 | Thinking inside the box

A new release rfoaas is now on CRAN following up on the recent upstream release 0.1.8 of FOAAS. The rfoaas package provides an interface for R to the most excellent FOAAS service--which provides a modern, scalable and RESTful web service for the frequent need to tell someone to f$#@ off. Release 0.1.8 ... [Read more...]

Installing R-devel on Linux (Ubuntu/Mint)

October 24, 2015 | Henrik Singmann

This post has been updated: 1. March 2018: Removed `bash ./tools/rsync-recommended` and  `bash ./tools/link-recommended`. They should not be needed anymore. 15. November 2017: Removed installing of recommended packages from build script. Those packages are now simply installed in the local library path which is also added to the `LIB_SITE`. This also ... [Read more...]

Less Drama, More Encoding

October 24, 2015 | hrbrmstr

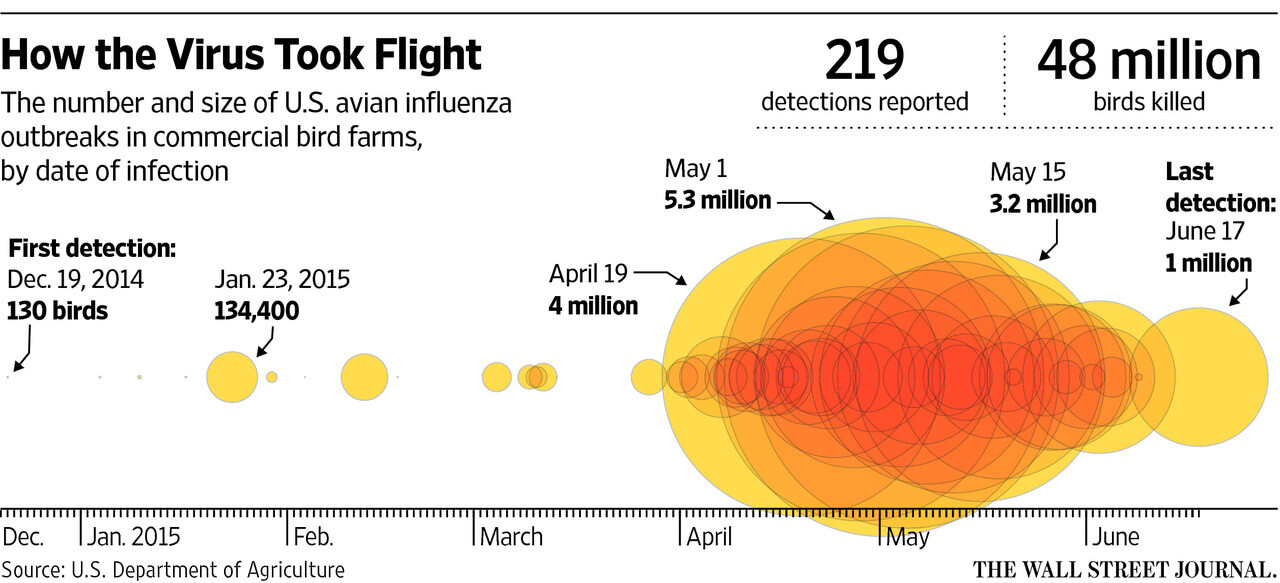
Junk Charts adeptly noted and fixed this excessively stylized chart from the WSJ this week: Their take on it does reduct the ZOMGOSH WE ARE DOOMED! look and feel of the WSJ chart: But, we can further reduce the drama by using a more neutral color encoding and encode both ...
[Read more...]

What Does the AVERAGE Brand Logo Look Like?

October 23, 2015 | The Clerk

PNG images are essentially a grid of values that represent colors to display. Since each cell in the grid is made up of numbers, I got curious about what it might mean to aggregate multiple PNGs. What would it look like to average two or more images? Median? Mode? Random?... [Read more...]

What Does the AVERAGE Brand Logo Look Like?

October 23, 2015 | The Clerk

PNG images are essentially a grid of values that represent colors to display. Since each cell in the grid is made up of numbers, I got curious about what it might mean to aggregate multiple PNGs. What would it look like to average two or more images? Median?To do ... [Read more...]
1 28 29 30 31 32 143

Never miss an update!
Subscribe to R-bloggers to receive
e-mails with the latest R posts.
(You will not see this message again.)

Click here to close (This popup will not appear again)