October 2015

How to Change the Reference Map in Choroplethr

October 8, 2015 | Ari Lamstein

Last week I released an update to choroplethr that lets you combine choropleth maps with reference maps. Since that post many people have asked if it’s possible to change the reference map that choroplethr uses. The answer is yes, but it requires some code. Here is the same choropleth (...
[Read more...]

User-friendly scaling

October 8, 2015 | Gavin L. Simpson

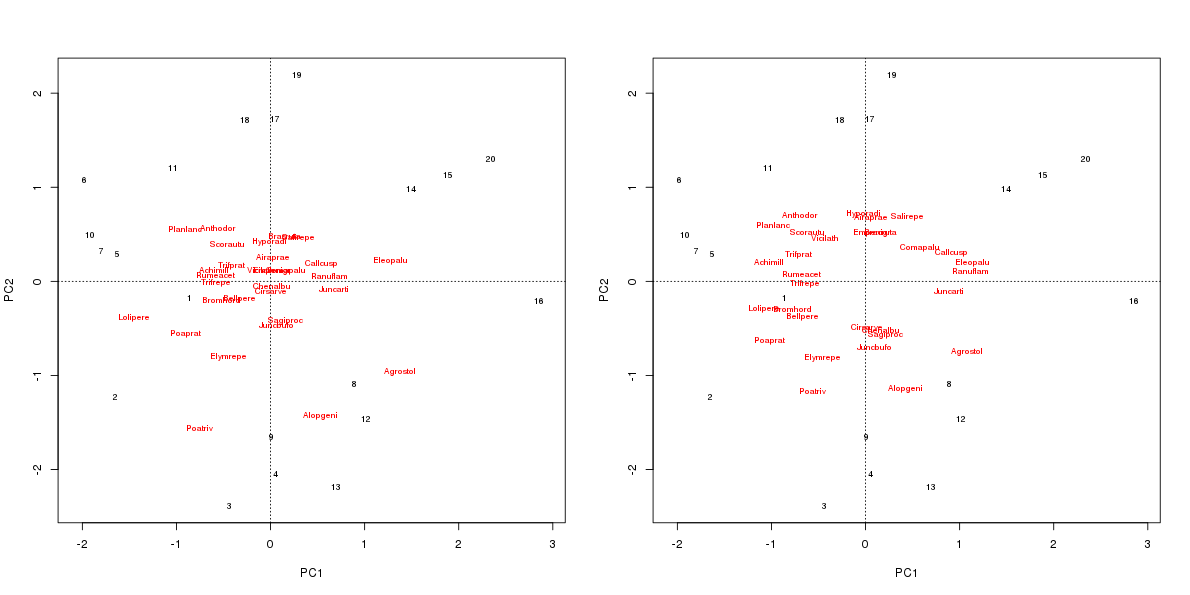
Back in the mists of time, whilst programming early versions of Canoco, Cajo ter Braak decided to allow users to specify how species and site ordination scores were scaled relative to one another via a simple numeric coding system. This was fine for the DOS-based software that Canoco was at ...
[Read more...]

User-friendly scaling

October 8, 2015 | Gavin L. Simpson

Back in the mists of time, whilst programming early versions of Canoco, Cajo ter Braak decided to allow users to specify how species and site ordination scores were scaled relative to one another via a simple numeric coding system. This was fine for the DOS-based software that Canoco was at ... [Read more...]

Slate Middle East Graph #2

October 7, 2015 | Sam Weiss

I recently saw Slate.com redid its Mideast Graphic and thought it would be good to redo my previous analysis. From the original slate graphic it's hard to make much sense of what's happening and who's friends with whom.From the graph below we can ... [Read more...]

Using purrr with dplyr

October 7, 2015 | - rstats

Update: Most of the data frame functions in purrr have been deprecated in favour of a new family of functions in dplyr. The intent is to better separate the responsibilities of packages in the tidyverse. First of all map() now always returns a list. It no longer preserves the data ... [Read more...]

Using purrr with dplyr

October 7, 2015 | - rstats

purrr was finally released on CRAN last week. This package is focused on working with lists (and data frames by the same token). However it is not a DSL for lists in the way dplyr is a DSL for data frames. It aims at creating a "better standard lib" focused ... [Read more...]

Visualising a Circular Density

October 7, 2015 | arthur charpentier

This afternoon, Jean-Luc asked me some help about an old post I did publish, minuit, l’heure du crime; and some graphs published a few days after, where I used a different visualisation, in another post. The idea is that the hour can be seen as circular, in the sense ... [Read more...]

Some key Win-Vector serial data science articles

October 7, 2015 | John Mount

As readers have surely noticed the Win-Vector LLC blog isn’t a stream of short notes, but instead a collection of long technical articles. It is the only way we can properly treat topics of consequence. What not everybody may have noticed is a number of these articles are serialized ...
[Read more...]

The butterfly curve

October 7, 2015 | Daniel Marcelino

I came across the butterfly curve, which was discovered by Temple Fay. The butterfly curve is produced by a parametric equation where: x = sin(t) * (e^cos(t)-2cos(λt)-sin(t/12)^5) and y = cos(t) * (e^cos(t)-2cos(λt)-sin(t/12)^5). Where t stands for time ... [Read more...]

Parameters and percentiles (the gamma distribution)

October 7, 2015 | Andrie de Vries

by Andrie de Vries In one of John D. Cooke's blog posts of 2010 (Parameters and Percentiles), he poses the following problem: The doctor says 10% of patients respond within 30 days of treatment and 80% respond within 90 days of treatment. Now go turn that into a probability distribution. That’s a common task ... [Read more...]

Stanford seminar

October 7, 2015 | R on Rob J Hyndman

I gave a seminar at Stanford today. Slides are below. It was definitely the most intimidating audience I’ve faced, with Jerome Friedman, Trevor Hastie, Brad Efron, Persi Diaconis, Susan Holmes, David Donoho and John Chambers all present (and probably other famous names I’ve missed). I’ll be giving ...
[Read more...]

Stanford seminar

October 7, 2015 | Rob J Hyndman

I gave a seminar at Stanford today. Slides are below. It was definitely the most intimidating audience I’ve faced, with Jerome Friedman, Trevor Hastie, Brad Efron, Persi Diaconis, Susan Holmes, David Donoho and John Chambers all present (and probably other famous names I’ve missed). I’ll be giving ... [Read more...]

Getting into the zone(s) with R + jsonlite

October 6, 2015 | Bob Rudis (@hrbrmstr)

We have some strange data in cybersecurity. One of the (IMO) stranger data files is a Domain Name System (DNS) zone file. This file contains mappings between domain names and IP addresses (and other things) represented by “resource records”. Here’s an example for the dummy/example domain example.com: $... [Read more...]
1 9 10 11 12 13

Never miss an update!
Subscribe to R-bloggers to receive
e-mails with the latest R posts.
(You will not see this message again.)

Click here to close (This popup will not appear again)