Giving a Damn About Statistics: Baseball, Shark Attacks, and Green M&M’s
Want to share your content on R-bloggers? click here if you have a blog, or here if you don't.
Trying to hide from statistics is tough. Believe me. I tried.
And I did a pretty decent job keeping the subject at bay until my early twenties. Much like grammar, statistics are everywhere (wait…statistics …is everywhere?). It’s unavoidable. We see statistics in the news:
in the news…
and, well, it’s really all over the news.
With such an abundance of statistics being thrown around in today’s society, most people must have a firm grasp on their meaning, right? Could it be we don’t have as strong of a grasp on statistics as we thought? Well this certainly would explain why people still buy lottery tickets (1:175,000,000), but are still too scared of sharks to swim in the ocean (1:11,500,000).
Statistics education seems to lie dormant throughout grade school. Take me for example (pardon me while I make a widespread claim based solely upon my own experience – not very stats like). Up until my junior year of high school, the only stats lessons I received were from gym class teachers and sports coaches.
And it didn’t get any better. My first real encounter with a statistics course in high school did everything it possibly could to prevent any sort of intuitive, applied, ‘real world’ relevance to the subject. Distribution curves, t-tests, z-scores, and countless problems about flipping coins and green M&Ms didn’t win me over.
I did the bare minimum, and true story: I got a D in that class. On the last day, I literally got down on my knees and begged my teacher for a C- because I was applying to colleges. She did. I should send her some flowers.
Eventually senior college courses happened and my plague-like avoidance of the subject became a natural fascination. Fast forward a few years and I now do it for a living. What made the switch? Thanks to the dedication and passion of many professors, students, authors, and Wikipedia editors, I finally realized that I’d be hard pressed to find something MORE likely to be used ‘in the real world’ – a previous struggle that unfortunately fueled many years of academic apathy for me. This was my road to Damascus.
Statistics makes everything better. It equips us with the power to not only measure what’s going on, but to monitor changes over time, and most importantly, the ability to solve problems that arise.
It’s the driving force of modern medicine. With clinical research, it helps doctors know what makes us better, and what makes us worse.
The car you ride in made it off the lot because each part made fell within a certain range of acceptability. Statistics ensure safety.
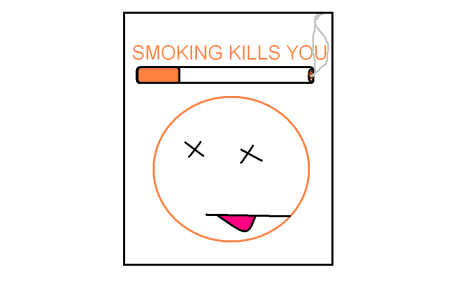
Statistical tools can tell us whether or not public health campaigns are working. Do advertisements that highlight how bad tobacco is make people smoke less?
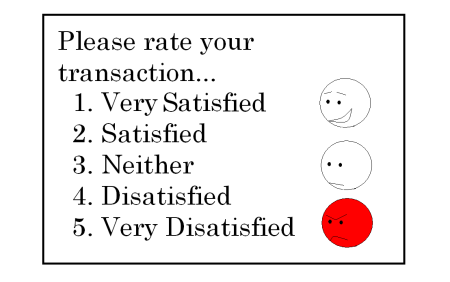
Businesses use statistics to measure customer happiness and to see what they can do better.
Making customers happy means more business.
More business means more people have jobs, and more people earn money, to buy more … stuff.
Statistics even makes sports better! Games are more entertaining. If teams drafted players with low batting averages and low RBIs, baseball would be more boring than it already is (if that’s possible!).
R is an amazing statistical tool to create, execute, visualize … and essentially solve (almost) all of the world’s problems. I’m looking forward to the rest of the year and continuing to hammer out some intuitive exercises with this blog. If you had some rough early encounters with stats or statistical programming, and they’ve left you with an unpleasant taste in your mouth, I urge you to reconsider and revisit this area. Statistics isn’t very hard; it’s just all about finding a teaching approach that makes things click for you, and I am here to *attempt* to provide that using a relevant, intuitive approach. If I had thrown in the towel after my first one (or three) terrible encounters with statistics teachers who may have been a little too dry – a little too abstract in their teachings for my personal learning style – I never would’ve gotten into this field. And man, do I love this field (in case you couldn’t tell from my crudely illustrated Paint renderings). Please sign up for my email list (at the very bottom) and even email me with some things you’d like to see on the site!
Statistics makes everything better (110%).
R-bloggers.com offers daily e-mail updates about R news and tutorials about learning R and many other topics. Click here if you're looking to post or find an R/data-science job.
Want to share your content on R-bloggers? click here if you have a blog, or here if you don't.

