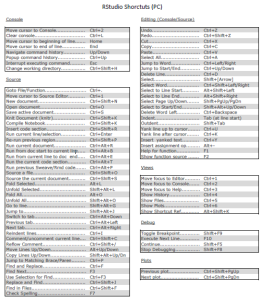
2014

Improving base-R examples

November 25, 2014 | richierocks

Earlier today I saw the hundred bazillionth question about how to use the paste function. My initial response was “take a look at example(paste) to see how it works”. Then I looked at example(paste), and it turns out that it’s not very good at all. There isn’... [Read more...]

Circlizing Numbers

November 24, 2014 | aschinchon

She makes the sound the sea makes to calm me down (Dissolve Me, Alt-J) Searching how to do draw chord diagrams in the Internet with ggplot2 I found a very-easy-to-use package called circlize which does exactly that. A chord diagram shows relationships between things so the input to draw it ...
[Read more...]

Secret to Making Things Appear in RStudio Viewer

November 24, 2014 | klr

I am by no means an authoritative source on this, but I think I found out the secret behind htmltools html_print that chooses the RStudio Viewer browser rather than your default browser like utils::browseURL. Here is a quick code snippet that hopefully... [Read more...]

Pipeline to Plot Annual % Change

November 24, 2014 | klr

Pipes in R make my life incredibly easy, and I think my code easier to read.   Note, there are a couple different flavors of pipes (see magrittr and pipeR).  For now, I choose pipeR.library(quantmod)library(pipeR)library(ggplot2)getSymbols("^GSPC",from="1900-01-01",auto.assign=F) %____% #get S&... [Read more...]

The data.table Cheat Sheet

November 24, 2014 | DataCamp

The data.table package provides an enhanced version of data.frame that allows you to do blazing fast data manipulations. data.table is being used in different fields such as finance and genomics, and is especially useful for those of you that are working with large data sets (e.g. 1... [Read more...]

an ABC experiment

November 23, 2014 | xi'an

  In a cross-validated forum exchange, I used the code below to illustrate the working of an ABC algorithm: Hence I used the median and the mad as my summary statistics. And the outcome is rather surprising, for two reasons: the first one is that the posterior on the mean μ is ...
[Read more...]

Interpreting regression coefficient in R

November 23, 2014 | grumble10

Linear models are a very simple statistical techniques and is often (if not always) a useful start for more complex analysis. It is however not so straightforward to understand what the regression coefficient means even in the most simple case when there are no interactions in the model. If we ...
[Read more...]
1 12 13 14 15 16 145

Never miss an update!
Subscribe to R-bloggers to receive
e-mails with the latest R posts.
(You will not see this message again.)

Click here to close (This popup will not appear again)