
R Object-oriented Programming – Book Review
<img src=' [Read more...]
Instagram a Termoli (CB)
div__Salvino A. Salvaggio, PhDSe Facebook, WhatsApp, Viber, Twitter e SnapChat —per citarne solo alcuni— fanno integralmente parte della vita quotidiana di giovani e meno giovani, non sono gli unici social networks sul mercato. Instagram, per esempio, e' stato adottato in massa perché consente di condividere facilmente su Internet foto ... [Read more...]
R Package or Library
In these days, I was talking about an R package I devel [...] [Read more...]
R, an Integrated Statistical Programming Environment and GIS
This article was originally published in Geoinformatics magazine.
R is well known as a powerful, extensible and relatively fast statistical programming language and open software project with a command line interface (CLI). What is less well known is that R also has cutting edge spatial packages that allow it to ...

Le Monde puzzle [#887quater]
And yet another resolution of this combinatorics Le Monde mathematical puzzle: that puzzle puzzled many more people than usual! This solution is by Marco F, using a travelling salesman representation and existing TSP software. N is a golden number if the sequence {1,2,…,N} can be reordered so that the sum ...
Mango Movember
This month the Mango Movember team have done a fantastic job of growing the most impressive moustaches. All cash raised is for research and awareness of, prostate cancer, testicular cancer and mental health problems. You can sponsor them using the following link: … Continue reading → [Read more...]
Power Outage Impact Choropleths In 5 Steps in R (featuring rvest & RStudio “Projects”)
I and @awpiii were trading news about the power outages in Maine & New Hampshire last night and he tweeted the link to the @PSNH Outage Map. As if the Bing Maps tiles weren’t bad enough, the use of a categorical color scale instead of a sequential one[1] caused sufficient ... [Read more...]
Eggnog for Thanksgiving
It's Thanksgiving Day here in the US, so we're taking the day off to spend some time with our families and to eat far too much food. If you're in the US or celebrating Thanksgiving elsewhere, enjoy the day! And for everyone in this season of joy, here's a handy ... [Read more...]
New Australian data on the HMD
The Human Mortality Database is a wonderful resource for anyone interested in demographic data. It is a carefully curated collection of high quality deaths and population data from 37 countries, all in a consistent format with consistent definitions. I have used it many times and never cease to be amazed at ... [Read more...]
How About a “Snowdoop” Package?
Along with all the hoopla on Big Data in recent years came a lot of hype on Hadoop. This eventually spread to the R world, with sophisticated packages being developed such as rmr to run on top of Hadoop. Hadoop made it convenient to process data in very large distributed ... [Read more...]
Tips and Tricks for Getting Started with R
All statistical software have a learning curve, and compared to SPSS, R has taken me more time to learn the basics. However, since learning the basics, R seems easier to use than SPSS. Here are 10 tips and tricks (and some resources) I found helpful for getting started with R: Use ... [Read more...]
Confidence vs. Credibility Intervals
Tomorrow, for the final lecture of the Mathematical Statistics course, I will try to illustrate - using Monte Carlo simulations - the difference between classical statistics, and the Bayesien approach. The (simple) way I see it is the following, for frequentists, a probability is a measure of the the frequency ... [Read more...]
Happy Thanksgiving | More Examples of XML + rvest with SVG
I did not intend for this little experiment to become a post, but I think the code builds nicely on the XML + rvest combination (also see yesterday’s post) for working with XML/HTML/SVG documents in R. It all started when I was playing on my iPhone i... [Read more...]
Slightly Advanced rvest with Help from htmltools + XML + pipeR
Hadley Wickham’s post “rvest: easy web scraping with R” introduces the fine new package rvest very well. For those now yearning a slightly more advanced example with a little help from pipeR + htmltools + XML, I thought this might fill your yea... [Read more...]
MilanoR meeting: 18th December
MilanoR staff is happy to announce the next MilanoR mee [...] [Read more...]
The beautiful R charts in London: The Information Capital
If you've lived in or simply love London, a wonderful new book for your coffee-table is London: The Information Capital. In 100 beautifully-rendered charts, the book explores the data that underlies the city and its residents. To create most of these charts, geographer James Cheshire and designer Oliver Uberti relied on ... [Read more...]
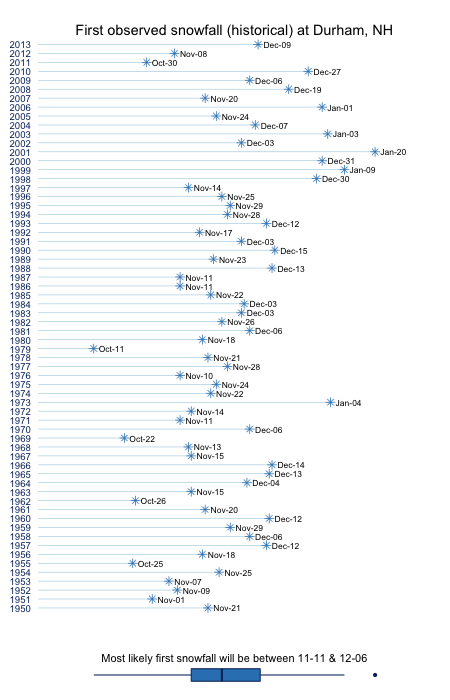
Visualizing Historical & Most-likely First Snowfall Dates for U.S. Regions
UPDATE: You can now run this as a local Shiny app by entering shiny::runGist("95ec24c1b0cb433a76a5", launch.browser=TRUE) at an R prompt (provided all the dependent libraries (below) are installed) or use it interactively over at Shiny Apps. The impending arrival of the first ...
The National Centre for Biotechnology Information (NCBI) is part…
The National Centre for Biotechnology Information (NCBI) is part of the National Institutes of Health’s National Library of Medicine, and most well-known for hosting Pubmed, the go-to search engine for biomedical literature - every (Medline-indexed) publication goes up there.
On a separate but related note, one thing I’m ... [Read more...]
Extracting NOAA sea surface temperatures with ncdf4
I’ve written previously about some example R scripts I created to extract sea surface temperature data from NOAA’s Optimum Interpolated Sea Surface Temperature products. If you want daily global sea surface temperatures on a 0.25×0.25° grid, they gather those into 1-year files available at http://www.esrl.noaa.gov/... [Read more...]

The gridGraphics Package (2014-03)
The gridGraphics package provides a function, grid.echo(), that can be used to convert a plot drawn with the graphics package to the same result drawn using grid. This provides access to a variety of grid tools for making customisations and … Continue reading →
[Read more...]