December 2014

Simulating Intricate Branching Patterns with DLA

December 16, 2014 | andrew

Manfred Schroeder's book Fractals, Chaos, Power Laws is a fruitful source of interesting topics and projects. He gives a thorough description of Diffusion-Limited Aggregation (DLA) as a technique for simulating physical processes which produce intricate branching structures. Examples, as illustrated below, include Lichtenberg Figures, dielectric breakdown, electrodeposition and Hele-Shaw flow. ... [Read more...]

The Awesome Parrondo’s Paradox

December 15, 2014 | aschinchon

A technique succeeds in mathematical physics, not by a clever trick, or a happy accident, but because it expresses some aspect of physical truth (O. G. Sutton) Imagine three unbalanced coins: Coin 1: Probability of head=0.495 and probability of tail=0.505 Coin 2: Probability of head=0.745 and probability of tail=0.255 Coin 3: Probability of ...
[Read more...]

New Package: partools

December 15, 2014 | matloff

I mentioned last week that I would be putting together a package, based in part on my posts on Snowdoop.  I’ve now done so, in a package partools., with the name alluding to the fact that they are intended for use with the cluster-based part of R’s parallel ... [Read more...]

Cartography with complex survey data

December 15, 2014 | David Smith

Visualizing complex survey data is something of an art. If the data has been collected and aggregated to geographic units (say, counties or states), a choropleth is one option. But if the data aren't so neatly arranged, making visual sense often requires some form of smoothing to represent it on ... [Read more...]

Updated quantmod on CRAN

December 15, 2014 | Joshua Ulrich

An updated version of quantmod has just been released on CRAN.  This is my first submission as the new maintainer.  The major change was removing the dependency on the now-archived Defaults package.  End-users shouldn't notice ... [Read more...]

Review: Data Science at the Command Line

December 15, 2014 | Randy Zwitch

Admission: I didn’t really know how computers worked until around 2012. For the majority of my career, I’ve worked for large companies with centralized IT functions. Like many statisticians, I fell into a comfortable position of learning SAS in a Windows environment, had Ops people to fix any Unix ... [Read more...]

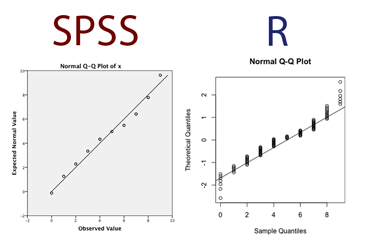
QQ-plots in R vs. SPSS – A look at the differences

December 15, 2014 | markheckmann

We teach two software packages, R and SPSS, in Quantitative Methods 101 for psychology freshman at Bremen University (Germany). Sometimes confusion arises, when the software packages produce different results. This may be due to specifics in the implemention of a method or, as in most cases, to different default settings. One ...
[Read more...]

Are high-reputation users quitting Stack Overflow?

December 14, 2014 | David Robinson

I spend a good amount of time on the programming Q+A site StackOverflow (and a smaller amount of time on its statistics sister site, Cross Validated). Recently this question on Meta Stack Overflow (the website’s discussion forum) caught my attention, raising the question of whether Stack Overflow had ... [Read more...]

A time series classification contest

December 14, 2014 | Rob J Hyndman

Amongst today’s email was one from someone running a private competition to classify time series. Here are the essential details. The data are measurements from a medical diagnostic machine which takes 1 measurement every second, and after 32–1000 seconds, the time series must be classified into one of two classes. Some ... [Read more...]

Monthly Weather in Netherlands

December 14, 2014 | Wingfeet

When I downloaded the KNMI meteorological data, the intention was to do something which takes more than just the computers memory. While it is clearly not big data, at the very least 100 years of daily data is not small either. So I took along a load o... [Read more...]

FOMC Dates – Price Data Exploration

December 14, 2014 | Peter Chan

As a first step in visualizing/exploring the data from my last post, FOMC Dates - Scraping Data From Web Pages, I’ll plot the FOMC announcement dates along with the following price series: 2-Year and 10-Year US Treasury yields, S&P500 ETF (SPY) and USD Index ETF (UUP).I’... [Read more...]
1 4 5 6 7 8 12

Never miss an update!
Subscribe to R-bloggers to receive
e-mails with the latest R posts.
(You will not see this message again.)

Click here to close (This popup will not appear again)