
Explore Kaggle Competition Data with R
Want to share your content on R-bloggers? click here if you have a blog, or here if you don't.
I wanted to pick a topic that involved some webscraping and so decided to get some data from Kaggle. I put down some questions that could potentially be answered with some fairly basic plots.
- Is prize money a key motivator for participants?
- Is prize money that is set based on perceived difficulty of the problem?
- Which knowledge competitions are popular?
- What is the best rank that a user has achieved in a country (among top 500 ranks)?
- How are the users (among top 500 ranks) distributed across countries?
It is likely that these questions are pretty basic and don’t need analysis but I just used some analysis here as a way for me to just play with extracted data
The file with code and detailed description are in the following location:
Is prize money a key motivator for participants?
The plot below shows the number of teams vs prize for competitions that offered prizes. There is not much of a trend indicating that prize money is not a key motivator for participants. This is probably not a surprise since participants are motivated by the thought of tackling challenging problems.

(you can access a zoomable plot with tootip here. Use left mouse and drag to zoom. Right click to reset zoom)
Is prize money that is set based on perceived difficulty of the problem?
Here I just used the competition duration as a surrogate for perceived difficulty of the problem by the sponsor. The plot below of prize vs duration does not show a trend indicating that the prize is not related to the duration (if you ignore the heritage health prize competition which is the point in far top right). It is possible that duration is not the right surrogate for problem difficulty and so the previous conclusion may not be correct. Another hypothesis could be that the prize is set based on estimated value of solving the problem and not necessarily based on how hard the problem is.

(you can access a zoomable plot with tootip here. Use left mouse and drag to zoom. Right click to reset zoom)
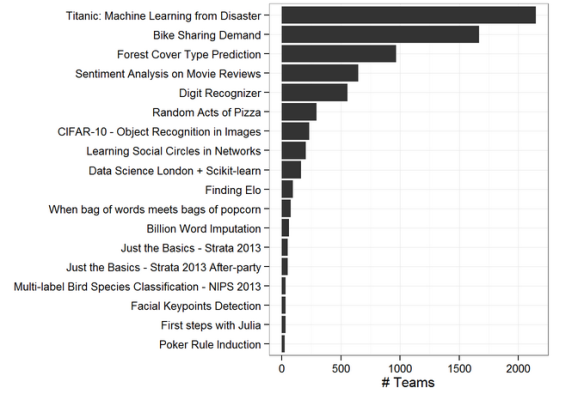
Which knowledge competitions are popular?
The bar graph of number of teams in knowledge competitions indicates that the two most popular competitions for learning are “Titanic Machine Learning” and “Bike Sharing Demand”.
What is the best rank that a user has achieved in a country (among top 500 ranks)?
The googleVis geo chart below shows the best rank of a user by country.

(you can access a zoomable plot with tootip here. Use left mouse and drag to zoom. Right click to reset zoom)
How are the users (among top 500 ranks) distributed across countries?
The googleVis geo chart below shows the number of users by country.

(you can access a zoomable plot with tootip here. Use left mouse and drag to zoom. Right click to reset zoom)
I had some fun doing this post and I hope you have some fun reading it. Happy Holidays.

R-bloggers.com offers daily e-mail updates about R news and tutorials about learning R and many other topics. Click here if you're looking to post or find an R/data-science job.
Want to share your content on R-bloggers? click here if you have a blog, or here if you don't.