
2014 World Cup Squads
Want to share your content on R-bloggers? click here if you have a blog, or here if you don't.
I have been having a go in R at visualising player movements for the World Cup. I wanted to use similar plots to those used to visualise international migration flows in the recent Science paper that I co-authored. In the end I came up with two plots. The first, and more complex one, is based on a non-square matrix of leagues system of players clubs by their national team.

You can zoom in and out if you click on the image.
Each line represents (in width) the amount of players moving between leagues and their national squads. The league system of a players club team is indicated by the joining of the base of the line to the grey ring, whilst the national squad of the players are represented by the arrow head on the line, as well as the colour of the line itself (which is based on the teams shirt colour). It’s a little cluttered, but shows nicely how many players in the English, Italian, Spanish and French leagues are involved in the world cup. It also highlights well some countries where almost all the players are at clubs abroad, for example most of the players in the African squads.
Whilst the first plot gave a lot of detail, I wanted to visualise the broader interactions, so I aggregated over leagues systems and national squads by regional confederations. This gives a square matrix:
> m
          squad
league     AFC CONCACAF CONMEBOL CAF UEFA
  AFC       49        2        1   3    1
  CONCACAF   0       13        0   0    0
  CONMEBOL   2        0       54  11    0
  CAF        0        0        0  36    0
  UEFA      41       99       37  86  296
The plot of which looks like:
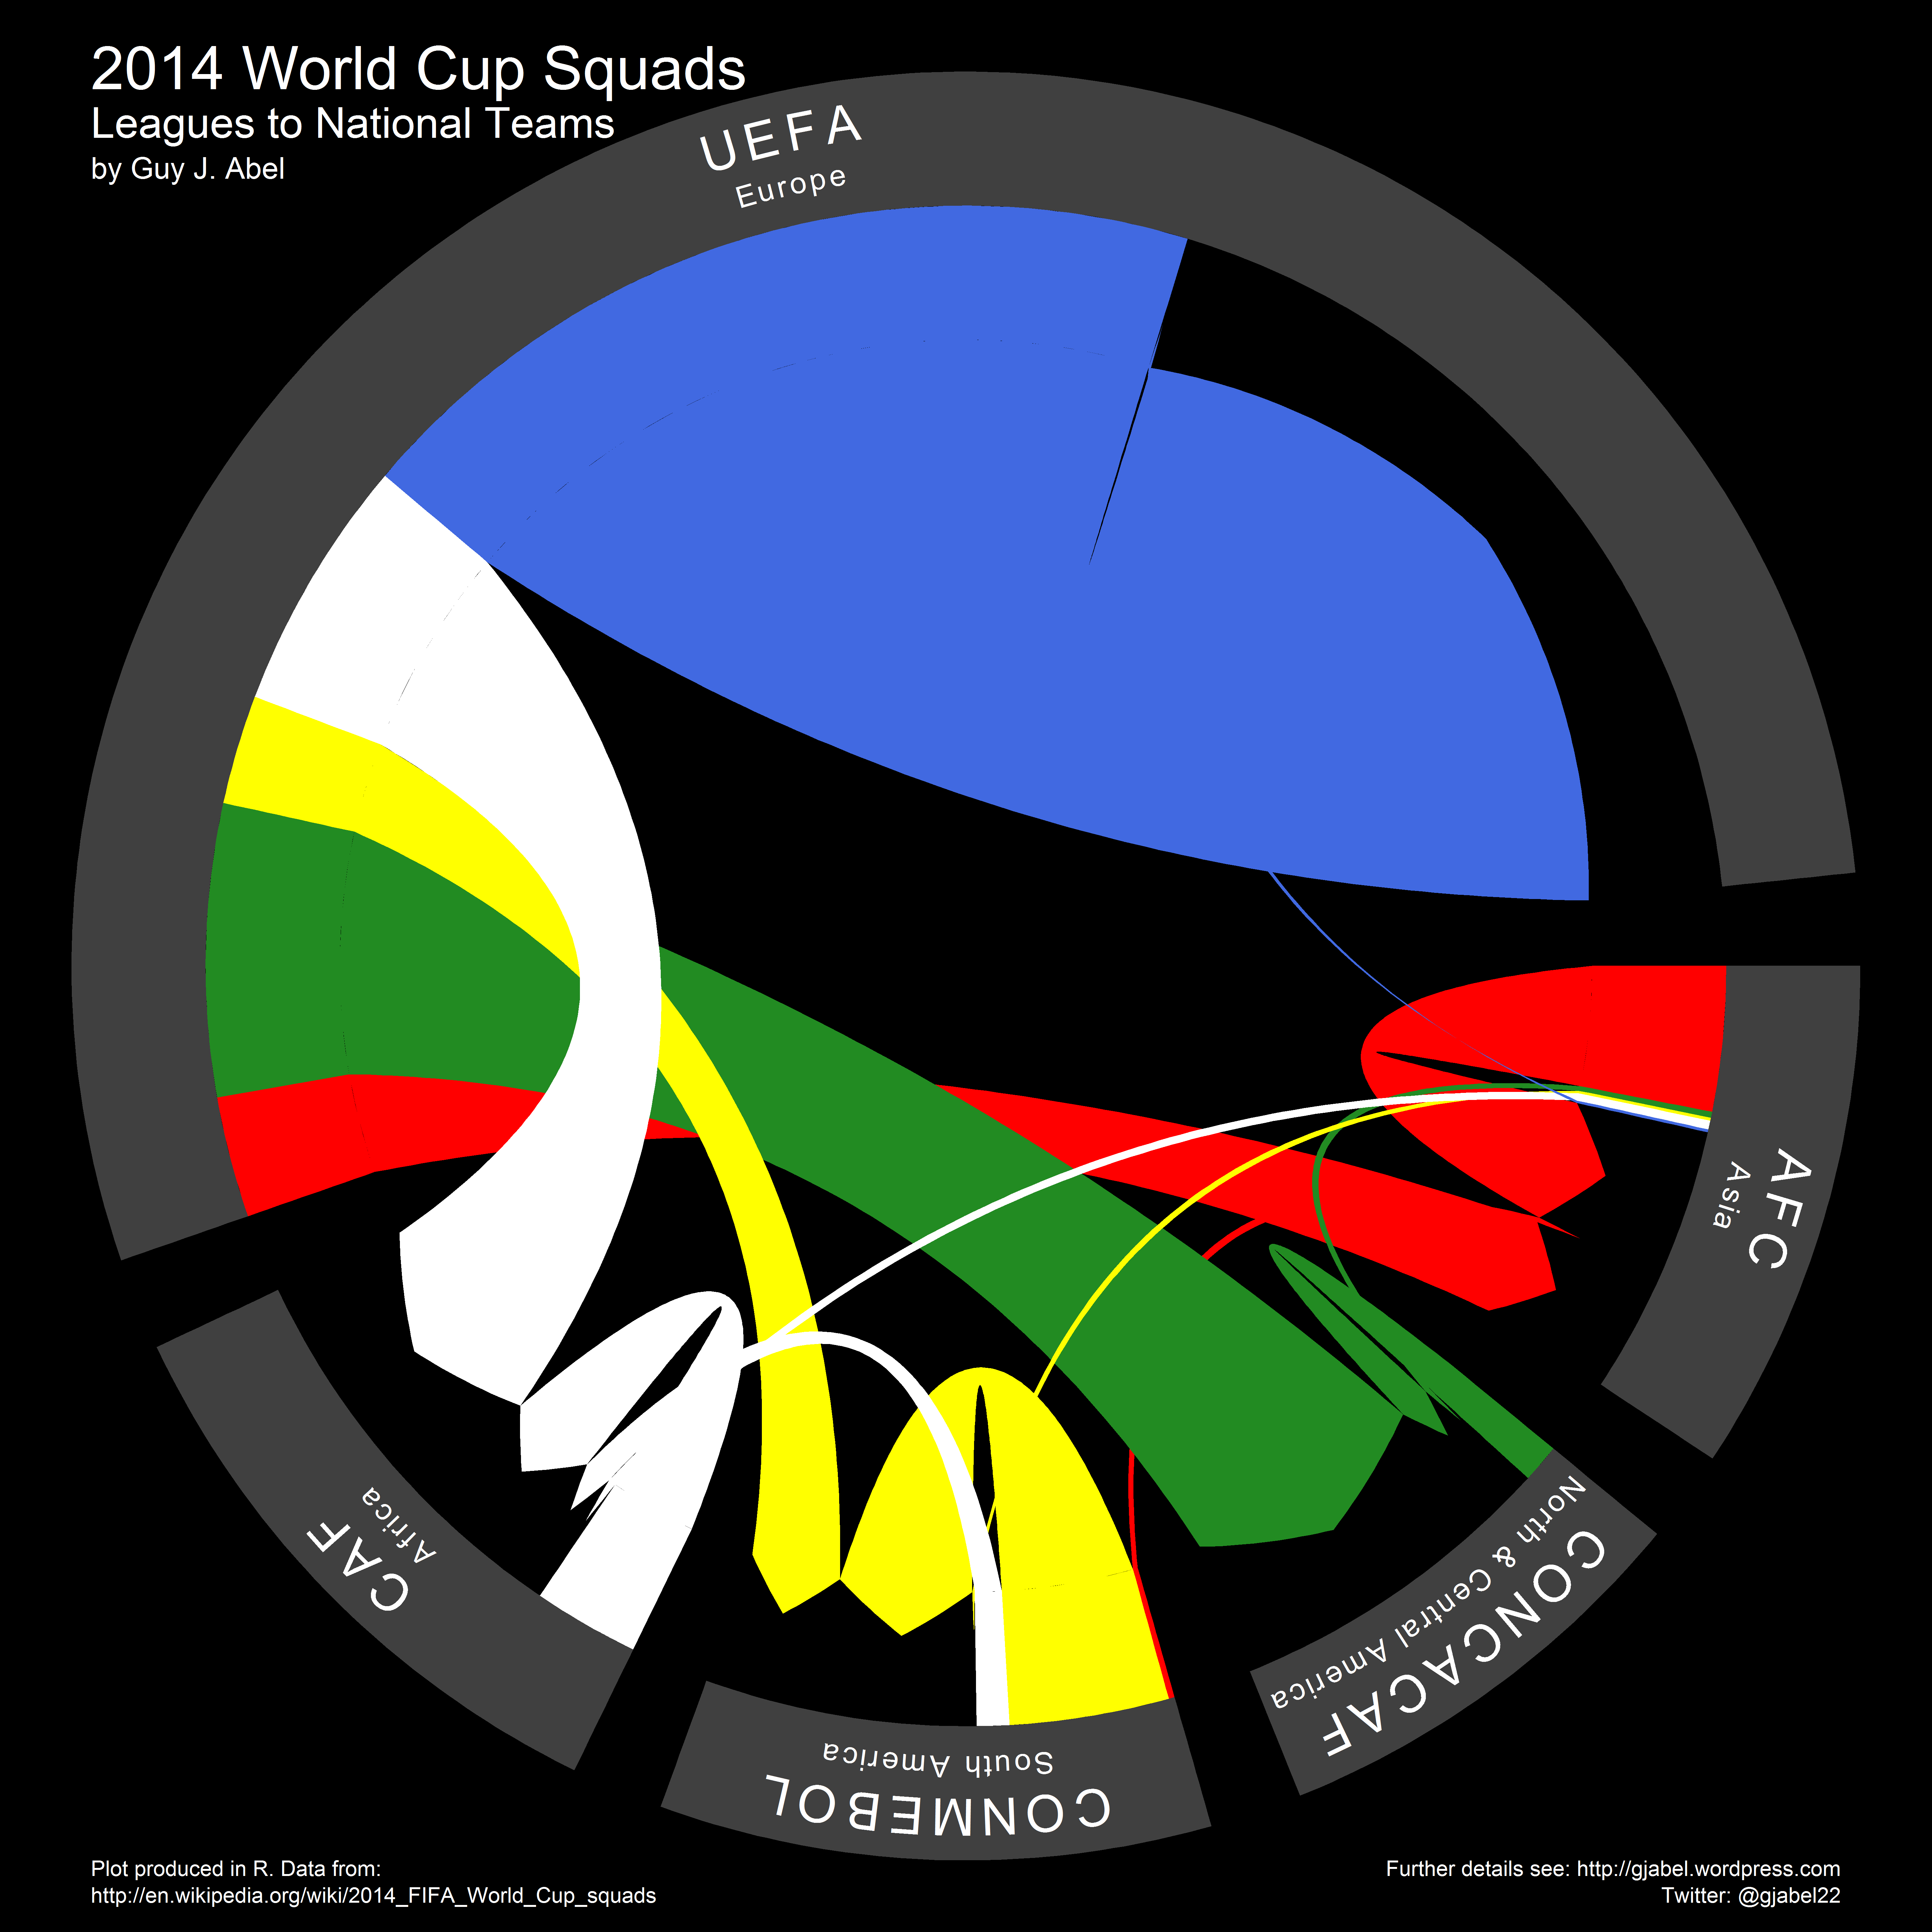
This type of aggregation works really well to show how few European national players play elsewhere (only Zvjezdan Misimovic in all the European World Cup squads). It also provides a way to compare the share of non-European players plying their trade in the European leagues to those in more local leagues within their confederation.
I scraped the data from the provisional squads on Wikipedia, and then created the images with the circlize package. All the code for the plots and scraping the Wikipedia squad pages are on the my github.

R-bloggers.com offers daily e-mail updates about R news and tutorials about learning R and many other topics. Click here if you're looking to post or find an R/data-science job.
Want to share your content on R-bloggers? click here if you have a blog, or here if you don't.