
Calendar Strategy: Option Expiry
Want to share your content on R-bloggers? click here if you have a blog, or here if you don't.
Today, I want to follow up with the Calendar Strategy: Month End post. Let’s examine the perfromance Option Expiry days as presented in the The Mooost Wonderful Tiiiiiiime of the Yearrrrrrrrr! post.
First, I created two convenience functions for creating a calendar signal and back-testing calendar strategy: calendar.signal and calendar.strategy functions are in the strategy.r at github
Now, let’s dive in and examine historical perfromance of SPY during Option Expiry period in December:
###############################################################################
# Load Systematic Investor Toolbox (SIT)
# http://systematicinvestor.wordpress.com/systematic-investor-toolbox/
###############################################################################
setInternet2(TRUE)
con = gzcon(url('http://www.systematicportfolio.com/sit.gz', 'rb'))
    source(con)
close(con)

	#*****************************************************************
	# Load historical data
	#******************************************************************
	load.packages('quantmod')

	tickers = spl('SPY')

	data <- new.env()
	getSymbols.extra(tickers, src = 'yahoo', from = '1980-01-01', env = data, set.symbolnames = T, auto.assign = T)
		for(i in data$symbolnames) data[[i]] = adjustOHLC(data[[i]], use.Adjusted=T)
	bt.prep(data, align='keep.all', fill.gaps = T)

	#*****************************************************************
	# Setup
	#*****************************************************************
	prices = data$prices
		n = ncol(prices)

	dates = data$dates

	models = list()

	universe = prices > 0

	# Find Friday before options expiration week in December
	years = date.year(range(dates))
	second.friday = third.friday.month(years[1]:years[2], 12) - 7
		key.date.index = na.omit(match(second.friday, dates))

	key.date = NA * prices
		key.date[key.date.index,] = T

	#*****************************************************************
	# Strategy: Op-ex week in December most bullish week of the year for the SPX
	#   Buy: December Friday prior to op-ex.
	#   Sell X days later: 100K/trade 1984-present
	# http://quantifiableedges.blogspot.com/2011/12/mooost-wonderful-tiiiiiiime-of.html
	#*****************************************************************
	signals = list(T0=0)
		for(i in 1:15) signals[[paste0('N',i)]] = 0:i
	signals = calendar.signal(key.date, signals)
	models = calendar.strategy(data, signals, universe = universe)

	strategy.performance.snapshoot(models, T, sort.performance=F)

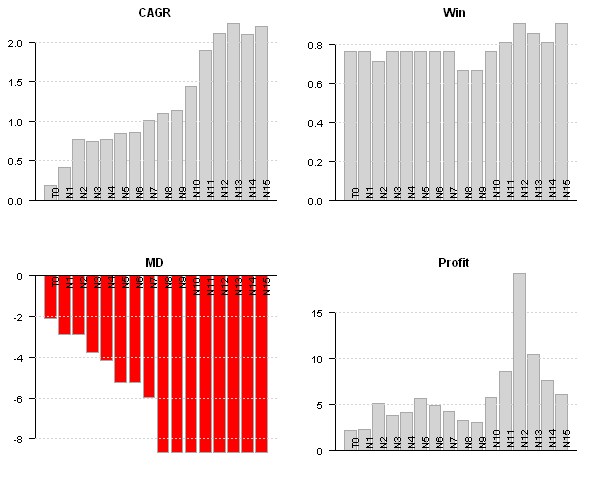
Strategies vary in perfromance, next let’s examine a bit more details
	# custom stats
	out = sapply(models, function(x) list(
		CAGR = 100*compute.cagr(x$equity),
		MD = 100*compute.max.drawdown(x$equity),
		Win = x$trade.summary$stats['win.prob', 'All'],
		Profit = x$trade.summary$stats['profitfactor', 'All']
		))
	performance.barchart.helper(out, sort.performance = F)

	# Plot 15 day strategy
	strategy.performance.snapshoot(models$N15, control=list(main=T))

	# Plot trades for 15 day strategy
	last.trades(models$N15)

	# Make a summary plot of trades for 15 day strategy
	trades = models$N15$trade.summary$trades
		trades = make.xts(parse.number(trades[,'return']), as.Date(trades[,'entry.date']))
	layout(1:2)
		par(mar = c(4,3,3,1), cex = 0.8)
	barplot(trades, main='Trades', las=1)
	plot(cumprod(1+trades/100), type='b', main='Trades', las=1)
Details for the 15 day strategy:


With this post I wanted to show how easily we can study calendar strategy performance using the Systematic Investor Toolbox.
Next, I will look at the importance of the FED meeting days.
To view the complete source code for this example, please have a look at the
bt.calendar.strategy.option.expiry.test() function in bt.test.r at github.

R-bloggers.com offers daily e-mail updates about R news and tutorials about learning R and many other topics. Click here if you're looking to post or find an R/data-science job.
Want to share your content on R-bloggers? click here if you have a blog, or here if you don't.