April 2014

Open Science Through R

April 13, 2014 | Dave Giles

There's so much being written about R these days, and justifiably so. If you use R for your econometrics, you should also keep in mind that its applicability is far wider than statistical analysis.  A big HT to the folks at Quandl for leading me to a nice overview of ... [Read more...]

ChIPseeker for ChIP peak annotation

April 13, 2014 | R on Guangchuang Yu

ChIPpeakAnno WAS the only one R package for ChIP peak annotation. I used it for annotating peak in my recent study. I found it does not consider the strand information of genes. I reported the bug to the authors, but they are reluctant to change. Read More: 2903 Words Totally [Read more...]

Earthquakes: Land / Ocean Distribution

April 13, 2014 | andrew

The next stage in my earthquake analysis project is to partition the events into groups with epicentre over land or water. Since our existing catalog contains the latitude and longitude for the epicentres, it was a relatively simple matter to pipe these into gmtselect and label the events accordingly. The ... [Read more...]

Following open courseware

April 13, 2014 | Wingfeet

I love massive open online courses such as provided on Coursera and edX. So I enrolled in the Data Analysis for Genomics course on edX. I am not alone there as seen from this posting on FreshBiostats.I was shocked when I took the Pre-Course R self-asse... [Read more...]

GeoCoding, R, and The Rolling Stones – Part 1

April 12, 2014 | steve

Originally posted on Rolling Your Rs:In this article I discuss a general approach for Geocoding a location from within R, processing XML reports, and using R packages to create interactive maps. There are various ways to accomplish this, though using Google’s GeoCoding service is a good place to ... [Read more...]

WrightMap 1.1 Ancillary Antelope Released

April 12, 2014 | R Snippets for IRT

The new version of WrightMap (Ancillary Antelope) is now available on CRAN. Remember that you can visit the package tutorials on our website. This new version includes: - New function to create fit graphs like the example below. - Parameter conversion: Function for calculating Thurstonian thresholds from Master’s deltas. ...
[Read more...]

Visualizing Age-Length Keys

April 12, 2014 | dogle

Lately, I have been interested in methods related to age-length keys. One aspect of this interest has been in visualizing age-length keys. I had seen various visualizations in publications and wanted to be able to reproduce those relatively efficiently. To … Continue reading → [Read more...]

chart with individual signals

April 12, 2014 | Thomas Huben

Also I'm not to much into Technical Indicators and Chart-Analysis during system development it is sometimes handy to visualize your buy and selllimits in a chart.The quantmod package provides a nice charting environment and you can select from a bunch ... [Read more...]

Using memoise to cache R values

April 12, 2014 | Dan Kelley Blog/R

Introduction The memoise package can be very handy for caching the results of slow calculations. In interactive work, the slowest calculations can be reading data, so that is demonstrated here. The microbenchmark package shows timing results. Methods and results Setup First, load the package being tested, and also a benchmarking ... [Read more...]

Shape File Selfies in ggplot2

April 11, 2014 | tylerrinker

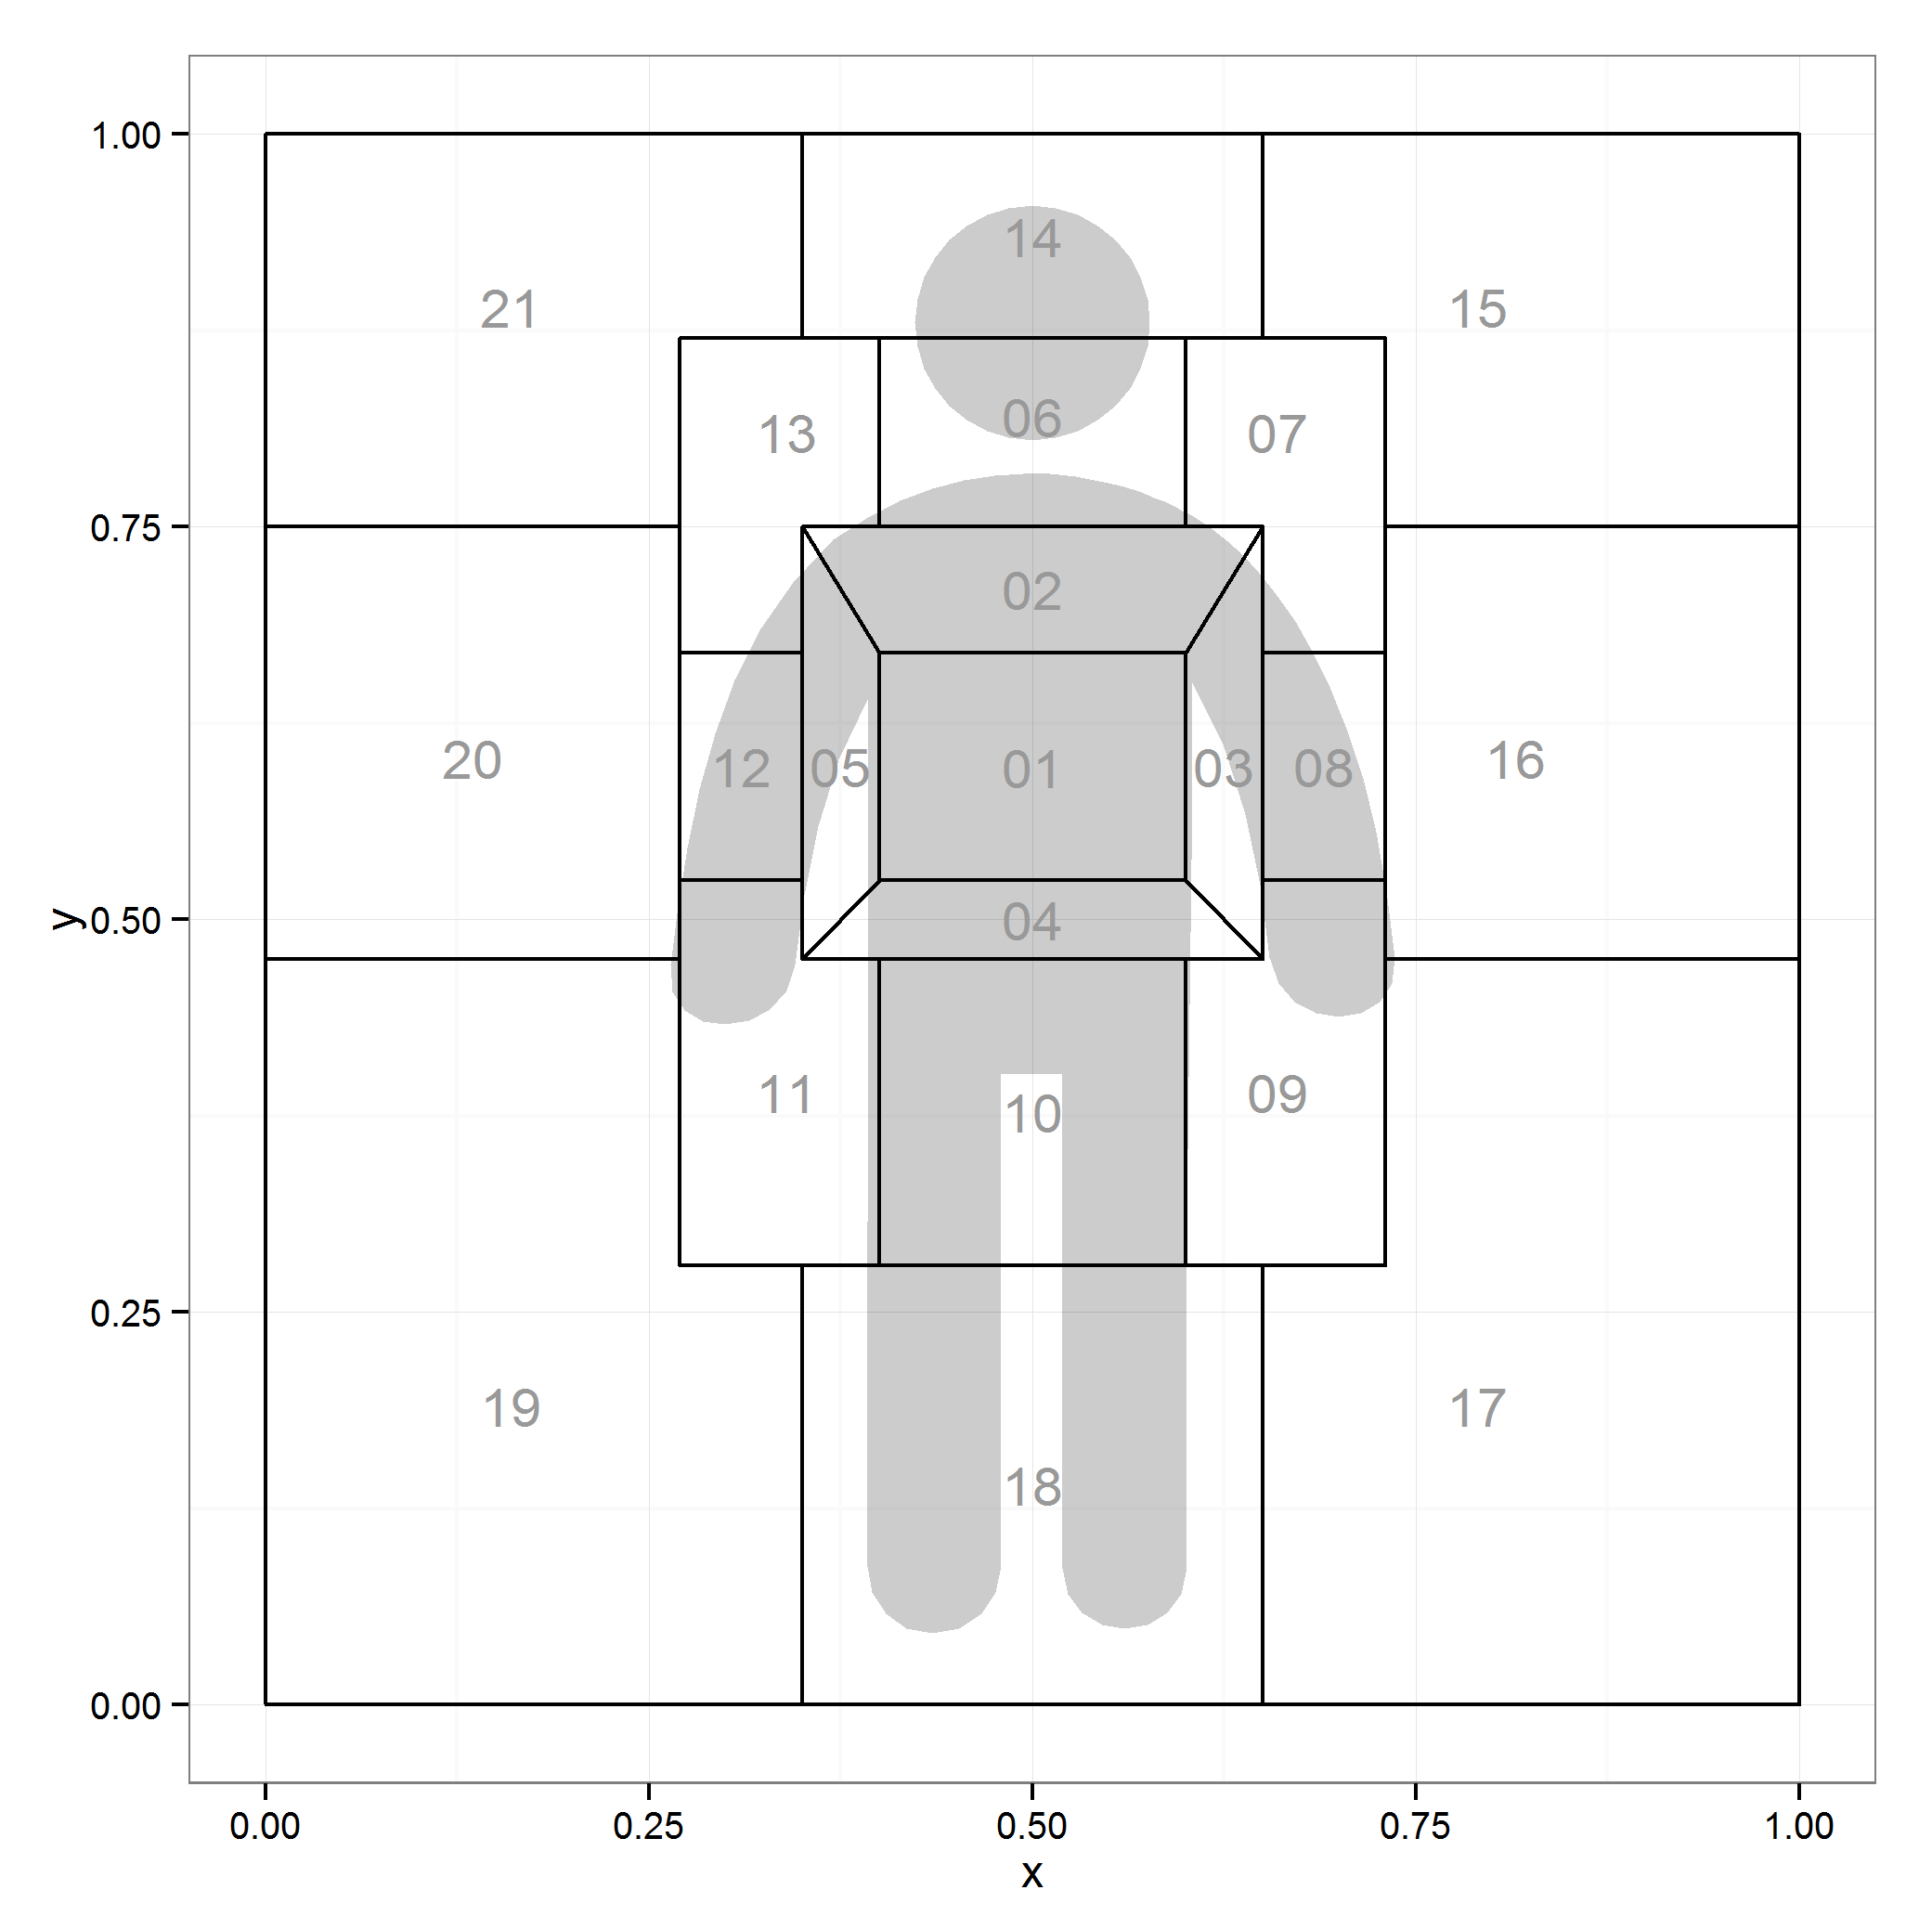
In this post you will learn how to: Create your own quasi-shape file Plot your homemade quasi-shape file in ggplot2 Add an external svg/ps graphic to a plot Change a grid grob's color and alpha *Note get simple .md version … Continue reading →
[Read more...]

Le Monde sans puzzle [& sans penguins]

April 11, 2014 | xi'an

As the Le Monde mathematical puzzle of this week was a geometric one (the quadrangle ABCD is divided into two parts with the same area, &tc…) , with no clear R resolution, I chose to bypass it. In this April 3 issue, several items of interest: first, a report by Etienne Ghys ... [Read more...]

Fortran and R – Speed Things Up

April 11, 2014 | steve

If you are a newcomer to R then you are probably quite busy learning the semantics of the language as you experiment with the apply family of commands or come up to speed on the grouping and conditioning capabilities offered by lattice graphics. And, along the way, you might have ... [Read more...]

Rblogger Posting Patterns Analyzed with R

April 11, 2014 | Mark T Patterson

I've been a big fan of rbloggers for quite some time, but have only recently started contributing myself. After my first post yesterday, I immidiately started wondering how long most other bloggers go between posts. I decided to gather the list of past posts to rbloggers to investigate a bit. ... [Read more...]
1 6 7 8 9 10 13

Never miss an update!
Subscribe to R-bloggers to receive
e-mails with the latest R posts.
(You will not see this message again.)

Click here to close (This popup will not appear again)