Probabilistic Momentum with Intraday data
Want to share your content on R-bloggers? click here if you have a blog, or here if you don't.
I want to follow up the Intraday data post with testing the Probabilistic Momentum strategy on Intraday data. I will use Intraday data for SPY and GLD from the Bonnot Gang to test the strategy.
##############################################################################
# Load Systematic Investor Toolbox (SIT)
# http://systematicinvestor.wordpress.com/systematic-investor-toolbox/
###############################################################################
setInternet2(TRUE)
con = gzcon(url('http://www.systematicportfolio.com/sit.gz', 'rb'))
    source(con)
close(con)

	#*****************************************************************
	# Load historical data
	#******************************************************************
	load.packages('quantmod')

	# data from http://thebonnotgang.com/tbg/historical-data/
	# please save SPY and GLD 1 min data at the given path
	spath = 'c:/Desktop/'
	data = bt.load.thebonnotgang.data('SPY,GLD', spath)

	data1 <- new.env()
		data1$FI = data$GLD
		data1$EQ = data$SPY
	data = data1
	bt.prep(data, align='keep.all', fill.gaps = T)

	lookback.len = 120
	confidence.level = 60/100

	prices = data$prices
		ret = prices / mlag(prices) - 1

	models = list()

	#*****************************************************************
	# Simple Momentum
	#******************************************************************
	momentum = prices / mlag(prices, lookback.len)
	data$weight[] = NA
		data$weight$EQ[] = momentum$EQ > momentum$FI
		data$weight$FI[] = momentum$EQ <= momentum$FI
	models$Simple  = bt.run.share(data, clean.signal=T)

	#*****************************************************************
	# Probabilistic Momentum + Confidence Level
	# http://cssanalytics.wordpress.com/2014/01/28/are-simple-momentum-strategies-too-dumb-introducing-probabilistic-momentum/
	# http://cssanalytics.wordpress.com/2014/02/12/probabilistic-momentum-spreadsheet/
	#******************************************************************
	ir = sqrt(lookback.len) * runMean(ret$EQ - ret$FI, lookback.len) / runSD(ret$EQ - ret$FI, lookback.len)
	momentum.p = pt(ir, lookback.len - 1)

	data$weight[] = NA
		data$weight$EQ[] = iif(cross.up(momentum.p, confidence.level), 1, iif(cross.dn(momentum.p, (1 - confidence.level)), 0,NA))
		data$weight$FI[] = iif(cross.dn(momentum.p, (1 - confidence.level)), 1, iif(cross.up(momentum.p, confidence.level), 0,NA))
	models$Probabilistic  = bt.run.share(data, clean.signal=T)

	data$weight[] = NA
		data$weight$EQ[] = iif(cross.up(momentum.p, confidence.level), 1, iif(cross.up(momentum.p, (1 - confidence.level)), 0,NA))
		data$weight$FI[] = iif(cross.dn(momentum.p, (1 - confidence.level)), 1, iif(cross.up(momentum.p, confidence.level), 0,NA))
	models$Probabilistic.Leverage = bt.run.share(data, clean.signal=T)

	#*****************************************************************
	# Create Report
	#******************************************************************
	strategy.performance.snapshoot(models, T)
Next, let’s examine the hourly perfromance of the strategy.
	#*****************************************************************
	# Hourly Performance
	#******************************************************************
	strategy.name = 'Probabilistic.Leverage'
	ret = models[[strategy.name]]$ret
		ret.number = 100*as.double(ret)

	dates = index(ret)
	factor = format(dates, '%H')

	layout(1:2)
	par(mar=c(4,4,1,1))
	boxplot(tapply(ret.number, factor, function(x) x),outline=T, main=paste(strategy.name, 'Distribution of Returns'), las=1)
	barplot(tapply(ret.number, factor, function(x) sum(x)), main=paste(strategy.name, 'P&L by Hour'), las=1)
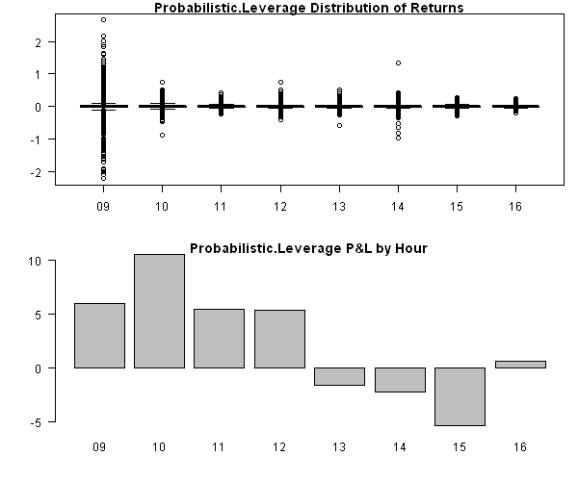
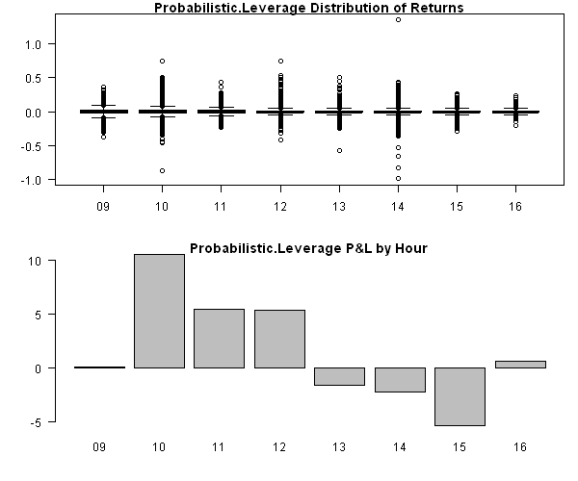
There are lots of abnormal returns in the 9:30-10:00am box due to big overnight returns. I.e. a return from today’s open to prior’s day close. If we exclude this observation every day, the distribution each hour is more consistent.
   	#*****************************************************************
   	# Hourly Performance: Remove first return of the day (i.e. overnight)
   	#******************************************************************
   	day.stat = bt.intraday.day(dates)
	ret.number[day.stat$day.start] = 0

   	layout(1:2)
   	par(mar=c(4,4,1,1))
	boxplot(tapply(ret.number, factor, function(x) x),outline=T, main=paste(strategy.name, 'Distribution of Returns'), las=1)
	barplot(tapply(ret.number, factor, function(x) sum(x)), main=paste(strategy.name, 'P&L by Hour'), las=1)
The strategy performs best in the morning and dwindles down in the afternoon and overnight.
These hourly seasonality plots are just a different way to analyze performance of the strategy based on Intraday data.
To view the complete source code for this example, please have a look at the bt.strategy.intraday.thebonnotgang.test() function in bt.test.r at github.
R-bloggers.com offers daily e-mail updates about R news and tutorials about learning R and many other topics. Click here if you're looking to post or find an R/data-science job.
Want to share your content on R-bloggers? click here if you have a blog, or here if you don't.


