TeXmacs. (I have to say that I am not totally objective, since I wrote the interface between R and TeXmacs…)
Here’s a sample window:

Installation
First, install TeXmacs. Best is to install the latest and greatest version of the svn, because that will include the latest changes of the interface with R, and in particular syntax highlighting. If you don’t install the latest version, you’ll probably only miss syntax highlighting. In that case it would probably be good to still install the latest version of the TeXmacs library for R.Now that TeXmacs is installed, we can start it.
From the command line, just enter:
texmacs
A nice window will open:

I will not go into how to work with TeXmacs very much, just the R interface.
Still, a few hints might help.
- You can chose your favorite key bindings in the menu Edit→Preferences→Look and Feel. I like emacs bindings.
- TeXmacs initially communicates with the user via the status line (bottom edge of window). If you prefer popups, select this from the menu Edit→Preferences→Interactive questions→In popup window.
- Usually TeXmacs files are stored with the extension “.tm”
- TeXmacs has a somewhat awkward interaction with the clipboard. Cut and paste within TeXmacs works fine. But, if you want to cut of paste to a different program, the text has to be converted from the special TeXmacs representation to text. To do that do:
Edit→Copy to→Verbatim and Edit→Paste from→Verbatim. If you copy/paste a lot from other programs, you can chose:
Tools→Selections→Import→Verbatim and Tools→Selections→Export→Verbatim. Then the default behaviour will be import and export in verbatim. - TeXmacs has a lot of documentation. Explore the help menu and use its search functions.
Using TeXmacs and R
After starting an R session, you get the usual R prompt ‘>’.
Type:
> 1:100
TeXmacs responds with the output from R:
 [1]  1  2  3  4  5  6  7  8  9 10 11 12 13 14 15 16 17 18
 [19] 19 20 21 22 23 24 25 26 27 28 29 30 31 32 33 34 35 36
 [37] 37 38 39 40 41 42 43 44 45 46 47 48 49 50 51 52 53 54
 [55] 55 56 57 58 59 60 61 62 63 64 65 66 67 68 69 70 71 72
 [73] 73 74 75 76 77 78 79 80 81 82 83 84 85 86 87 88 89 90
 [91] 91 92 93 94 95 96 97 98 99 100
What is nice in using TeXmacs as an interface to R is that you can now move up to the previous line, edit it, and press enter again. The output will be replaced by The new output.
If you would like to enter multiple lines of text at once, press shift-enter, instead of enter. The input field will expend, and nothing will be sent to the R process. Once you are done, press enter. Here is an example:

You also see two additional features: syntax highlighting, and special background colors for input and output text. To turn on this coloring scheme, select the aptly named menu item Document→add package→Program→varsession.
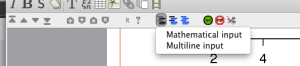
BTW: If you prefer to invert the behaviour of enter and shift-enter, select the option multiline input as shown below:
Graphics
TeXmacs+R can also handle graphics.Enter the following expression:
> plot(1:10);v()
Notice that after the first
plot() command, usually a new window pops up, and you have to select the TeXmacs window again.The result will look something like the following:

As you see, we needed two commands: the usual
plot call, and v(). v() inserts the current plot as is into TeXmacs. So you can now do the following:
> title("Our first sample plot");v()
Which gives:
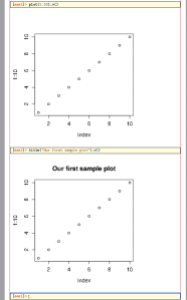
We now have a second copy of our graph, with a title. You could, of course, have done two plot commands and one
v().
> plot(1:10);title("Our first sample plot");v()
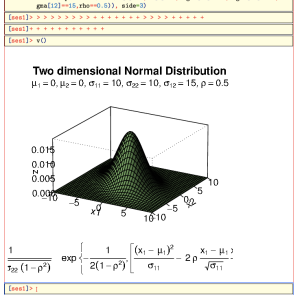
Let us try a more complicated example:
Here is a nice plot taken from the R Graph Gallery.
mu1mu2s11s12s22rhox1<-seq(-10,10,length=41) # generating the vector series x1
x2#
f<-function(x1,x2){
 term1  term2  term3  term4  term5  term1*exp(term2*(term3+term4-term5))
} # setting up the function of the multivariate normal density
#
z<-outer(x1,x2,f) # calculating the density values
#
persp(x1, x2, z,
      main="Two dimensional Normal Distribution",
      sub=expression(italic(f)~(bold(x))==frac(1,2~pi~sqrt(sigma[11]~
                     sigma[22]~(1-rho^2)))~phantom(0)~exp~bgroup("{",
              list(-frac(1,2(1-rho^2)),
              bgroup("[", frac((x[1]~-~mu[1])^2, sigma[11])~-~2~rho~frac(x[1]~-~mu[1],
              sqrt(sigma[11]))~ frac(x[2]~-~mu[2],sqrt(sigma[22])) ~+~
              frac((x[2]~-~mu[2])^2, sigma[22]),"]")),"}")),
      col="lightgreen",
      theta=30, phi=20,
      r=50,
      d=0.1,
      expand=0.5,
      ltheta=90, lphi=180,
      shade=0.75,
      ticktype="detailed",
      nticks=5) # produces the 3-D plot
# adding a text line to the graph
mtext(expression(list(mu[1]==0,mu[2]==0,sigma[11]==10,sigma[22]==10,sigma[12]==15,rho==0.5)), side=3)