Identical Champions League Draw: What Were the Odds?
Want to share your content on R-bloggers? click here if you have a blog, or here if you don't.
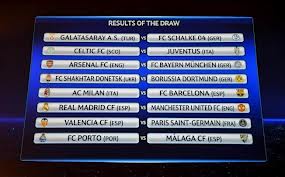
 A number of news outlets have reported a peculiar quirk that arose during Friday’s Champions League draw. Apparently, the sport’s European governing body, UEFA, ran a trial run the day before the main event, and the schedule chosen during this event was identical to that of the actual draw on Friday.
Given this strange coincidence, a number of people have been expressing the various odds of this occurrence. For example, the author of this newspaper article claimed that ‘bookies’ calculated the odds at 5,000 to 1. In other words, the probability of this event was 0.0002.
The same article also says that the probability of this event (two random draws being identical) occurring is not as low as one might think. However, this article does not give the probability or odds of this event occurring. The oblivious reason for this is that such a calculation is difficult. Since teams from the same domestic league and teams from the same country cannot play each other, such a calculation involves using conditional probabilities over a variety of scenarios.
Despite my training in Mathematics and interest in quantitative pursuits, I have always struggled to calculate the probability of multiple conditional events. Given that there are many different ways in which two identical draws can be made, such a calculation is, unfortunately, beyond my admittedly limited ability.
Thankfully, there’s a cheats way to getting a rough answer: use Monte Carlo simulation. The code below shows how to write up a function in R that performs synthetic draws for the Champions League given the aforementioned conditions. With this function, I performed two draws 200,000 times, and calculated that the probability of the identical draws is: 0.00011, so the odds are around: 1 in 9,090. This probability is subject to some sampling error, however getting a more accurate measure via simulation would require more computing power like that enabled by Rcpp (which I really need to learn). Nevertheless, the answer is clearly lower than that proposed either by the ‘bookies’ or the newspaper article’s author.
# cl draw
rm(list=ls())
setwd("C:/Users/Alan/Desktop")
dat <- read.csv("cldraw.csv")

#=============================
> dat
team iso pos group
1       Galatasaray TUR  RU     H
2           Schalke GER  WI     B
3            Celtic SCO  RU     G
4          Juventus ITA  WI     E
5           Arsenal ENG  RU     B
6            Bayern GER  WI     F
7  Shakhtar Donetsk UKR  RU     E
8          Dortmund GER  WI     D
9             Milan ITA  RU     C
10        Barcelona ESP  WI     G
11      Real Madrid ESP  RU     D
12      Man. United ENG  WI     H
13         Valencia ESP  RU     F
14              PSG FRA  WI     A
15            Porto POR  RU     A
16           Malaga ESP  WI     C
#=============================

draw <- function(x){
  fixtures <- matrix(NA,nrow=8,ncol=2)
  p <- 0
  while(p==0){
    for(j in 1:8){
      k <- 0
      n <- 0
      while(k==0){
        n <- n + 1
        if(n>50){break}
        aa <- x[x[,"pos"]=="RU",]
        t1 <- aa[sample(1:dim(aa)[1],1),]
        bb <- x[x[,"pos"]=="WI",]
        t2 <- bb[sample(1:dim(bb)[1],1),]
        k <- ifelse(t1[,"iso"]!=t2[,"iso"] & t1[,"group"]!=t2[,"group"],1,0)
      }
      fixtures[j,1] <- as.character(t1[,"team"])
      fixtures[j,2] <- as.character(t2[,"team"])
      x <- x[!(x[,"team"] %in% c(as.character(t1[,"team"]),
                                 as.character(t2[,"team"]))),]
    }
    if(n>50){p <- 0}
    p <- ifelse(sum(as.numeric(is.na(fixtures)))==0,1,0)
  }
  return(fixtures)
}

drawtwo <- function(x){
  f1 <- as.vector(unlist(x))
  joinup <- data.frame(team=f1[1:16], iso=f1[17:32],
                       pos=f1[33:48], group=f1[49:64])
  check1 <- data.frame(draw(joinup))
  check2 <- data.frame(draw(joinup))
  rightdraw <- ifelse(sum(na.omit(check1[order(check1),2])==
    na.omit(check2[order(check2),2]))==8, 1, 0)
  return(rightdraw)
}

drawtwo(dat)

dat2 <- rbind(as.vector(unlist(dat)),
              as.vector(unlist(dat)))
dat3 <- dat2[rep(1,1000),]

vals <- 0
for(i in 1:200){
  yy <- apply(dat3, 1, drawtwo)
  vals <- sum(yy) + vals
}
#=============================
# Probability
> vals/200000
[1] 0.00011
# Odds
> 1/(vals/200000)-1
[1] 9089.909
#=============================
R-bloggers.com offers daily e-mail updates about R news and tutorials about learning R and many other topics. Click here if you're looking to post or find an R/data-science job.
Want to share your content on R-bloggers? click here if you have a blog, or here if you don't.
