
Clustering with selected Principal Components
Want to share your content on R-bloggers? click here if you have a blog, or here if you don't.
In the Visualizing Principal Components post, I looked at the Principal Components of the companies in the Dow Jones Industrial Average index over 2012. Today, I want to show how we can use Principal Components to create Clusters (i.e. form groups of similar companies based on their distance from each other)
Let’s start by loading the historical prices for the the companies in the Dow Jones Industrial Average index that we saved in the Visualizing Principal Components post.
###############################################################################
# Load Systematic Investor Toolbox (SIT)
# http://systematicinvestor.wordpress.com/systematic-investor-toolbox/
###############################################################################
setInternet2(TRUE)
con = gzcon(url('http://www.systematicportfolio.com/sit.gz', 'rb'))
    source(con)
close(con)

	#*****************************************************************
	# Load historical data
	#******************************************************************
	load.packages('quantmod')

	# load data saved in the bt.pca.test() function
	load(file='bt.pca.test.Rdata')

	#*****************************************************************
	# Principal component analysis (PCA), for interesting discussion
	# http://machine-master.blogspot.ca/2012/08/pca-or-polluting-your-clever-analysis.html
	#******************************************************************
	prices = data$prices
	ret = prices / mlag(prices) - 1

	p = princomp(na.omit(ret))

	loadings = p$loadings[]

	x = loadings[,1]
	y = loadings[,2]
	z = loadings[,3]
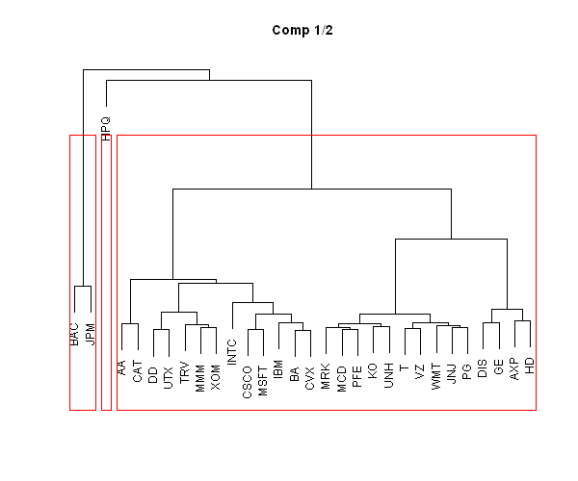
To create Clusters, I will use the hierarchical cluster analysis, hclust function, in stats package. The first argument in the hclust function is the distance (dissimilarity) matrix. To compute distance matrix, let’s take the first 2 principal components and compute the Euclidean distance between each company:
	#*****************************************************************
	# Create clusters
	#******************************************************************
	# create and plot clusters based on the first and second principal components
	hc = hclust(dist(cbind(x,y)), method = 'ward')
	plot(hc, axes=F,xlab='', ylab='',sub ='', main='Comp 1/2')
	rect.hclust(hc, k=3, border='red')
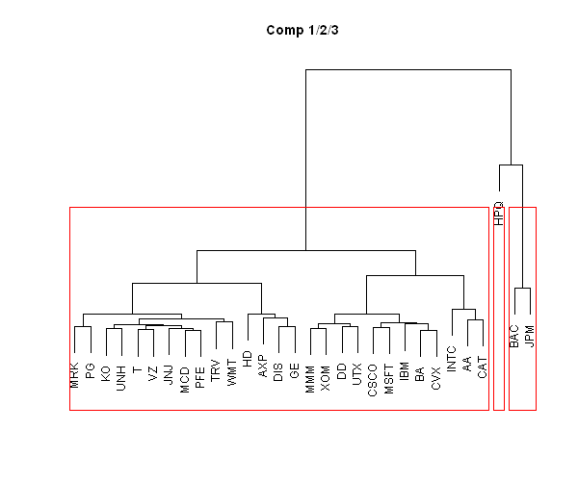
Similarly we can use the first three principal components:
	# create and plot clusters based on the first, second, and third principal components
	hc = hclust(dist(cbind(x,y,z)), method = 'ward')
	plot(hc, axes=F,xlab='', ylab='',sub ='', main='Comp 1/2/3')
	rect.hclust(hc, k=3, border='red')
Another option is to use the Correlation matrix as a proxy for a distance matrix:
	# create and plot clusters based on the correlation among companies
	hc = hclust(as.dist(1-cor(na.omit(ret))), method = 'ward')
	plot(hc, axes=F,xlab='', ylab='',sub ='', main='Correlation')
	rect.hclust(hc, k=3, border='red')
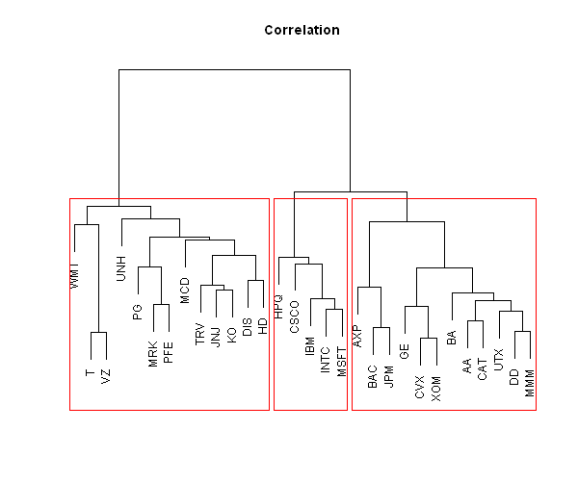
Please note that Clusters will be quite different, depending on the distance matrix you use.
To view the complete source code for this example, please have a look at the bt.clustering.test() function in bt.test.r at github.

R-bloggers.com offers daily e-mail updates about R news and tutorials about learning R and many other topics. Click here if you're looking to post or find an R/data-science job.
Want to share your content on R-bloggers? click here if you have a blog, or here if you don't.