
Two tips: adding title for graph with multiple plots; add significance asterix onto a boxplot
[This article was first published on One Tip Per Day, and kindly contributed to R-bloggers]. (You can report issue about the content on this page here)
Want to share your content on R-bloggers? click here if you have a blog, or here if you don't.
I’ve not added tips for a while. Here is it for today:Want to share your content on R-bloggers? click here if you have a blog, or here if you don't.
1. How to add title for graph with multiple plots?
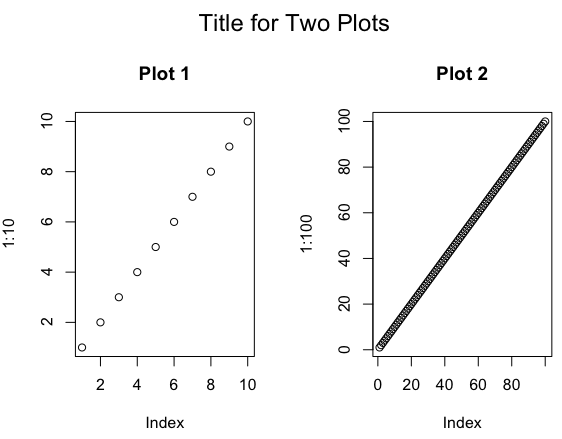
plot(1:10, main=”Plot 1″)
plot(1:100, main=”Plot 2″)
mtext(“Title for Two Plots”, outer = TRUE, cex = 1.5)
2. How to add text (e.g. asterix for significance) onto a boxplot?
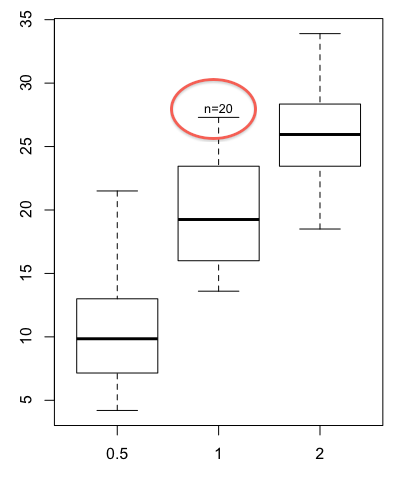
boxplot(len ~ dose, data = ToothGrowth, outline=F)
text(x=2,y=max(boxplot.stats(ToothGrowth$len[ToothGrowth$dose==1])$stat), paste(“n”,sum(ToothGrowth$dose==1),sep=”=”), pos=3, offset=.2, cex=.8)
To leave a comment for the author, please follow the link and comment on their blog: One Tip Per Day.
R-bloggers.com offers daily e-mail updates about R news and tutorials about learning R and many other topics. Click here if you're looking to post or find an R/data-science job.
Want to share your content on R-bloggers? click here if you have a blog, or here if you don't.