
PCA for NIR Spectra_part 003: "NIPALS"
[This article was first published on NIR-Quimiometría, and kindly contributed to R-bloggers]. (You can report issue about the content on this page here)
Want to share your content on R-bloggers? click here if you have a blog, or here if you don't.
Want to share your content on R-bloggers? click here if you have a blog, or here if you don't.
> X<-yarn$NIR
> X_nipals<-nipals(X,a=10,it=100)
Two matrices are generated (P and T)
As in other posts, we are going to look to the loadings & scores, for firsts three principal components:
> wavelengths<-seq(1,268,by=1)
> matplot(wavelengths,X_nipals$P[,1:3],lty=1,
+ pch=21,xlab=”data_points”,ylab=”log(1/R)”)

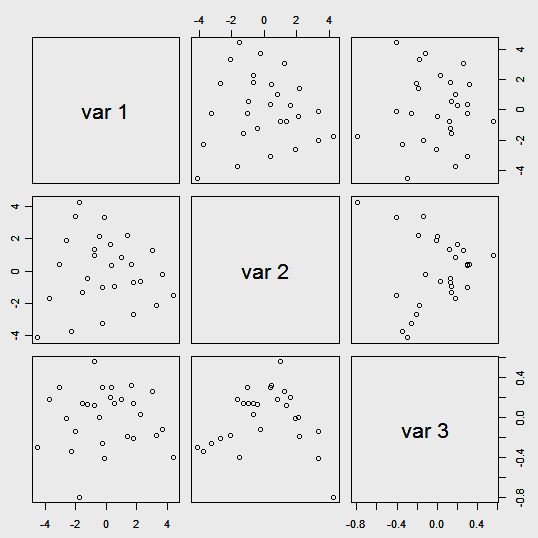
> T3cp<-X_nipals$T[,1:3]
> pairs(T3cp)

We can see how the first PC (PC1) has the same shape for both. The other two (PC2 & PC3) has also the same shape, but inverted).
Let´s compare the scores plots:
Red dots for NIPALS, black for SVD:

To leave a comment for the author, please follow the link and comment on their blog: NIR-Quimiometría.
R-bloggers.com offers daily e-mail updates about R news and tutorials about learning R and many other topics. Click here if you're looking to post or find an R/data-science job.
Want to share your content on R-bloggers? click here if you have a blog, or here if you don't.