
Job Search Part 4: Timing Beveridge Curve Movements During A Recession
[This article was first published on The Dancing Economist, and kindly contributed to R-bloggers]. (You can report issue about the content on this page here)
Want to share your content on R-bloggers? click here if you have a blog, or here if you don't.
This economics blogger feels like he would be cheating the reader if he did not include recent work done by Barnichon and Figura (2010) on timing movements in the unemployment rate during recessions. That is why this is part 4 of my special 5 part mini-series on the modern job search and matching theory of unemployment. Want to share your content on R-bloggers? click here if you have a blog, or here if you don't.
In recessions there are a series of events that take place in the labor market. Unlike market-clearing models, real life agents are not in fact homogeneous and do react over time rather than instantaneously. At the beginning of a recession, the Beveridge curve shifts out because of an increase in temporary layoffs. A quarter later, a clockwise rotation of the job creation curve moves unemployment along the Beveridge curve as firms adjust vacancies. The Beveridge curve also shifts out further because of an increase in permanent layoffs. One quarter later the labor supply reacts and the Beveridge curve shifts in slightly as quits decline but shifts out further as workers display a stronger attachment to the labor force. What follows is a graphical representation of the logical pattern of events that takes place during recessions.
Figure A: Increase In Temporary Layoffs

Figure A describes the very beginning of a recession when there is an increase in the amount of temporary layoffs. The Beveridge curve shifts out from BC0 to BC1 because of an increase in temporary layoffs. The vacancy rate moves from V* to V1 and the unemployment rate increases from U* to U1 as we move from point A to B.
Figure B: Firms Cut Back Vacancies and Job Openings

Figure C: Increase in Permanent Layoffs

Figure D: Slight Decline in Quits
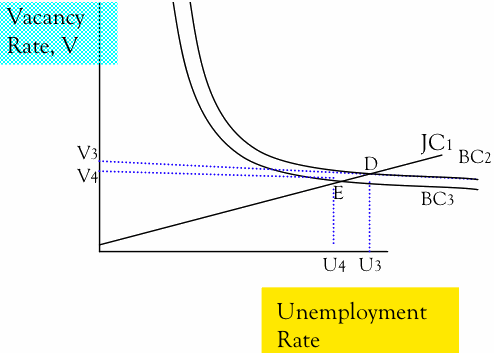
Figure E: Workers have a stronger attachment to the labor force

While only suggestive, this chain of events could indicate that labor supply responds to labor demand at cyclical frequencies. When the job creation curve rotated downward it was all labor demand, and since it remained flat shifts in the Beveridge curve translated to almost a full increase in the unemployment rate by the same amount. Although labor supply responds to labor demand when we experience high amounts of volatility (either during expansions or contractions) over the long-run however unemployment is driven by secular changes in labor supply, specifically the aging of the baby boomers and the increasing attachment of women to the labor force.
Modeling The Influence of Labor Demand on Unemployment
In the above section we followed Barnichon and Figura (2010) work and arrived at the conclusion that at cyclical frequencies (during recessions and expansions) labor demand was the prime driver behind movements in the unemployment rate. I sought to test their theory by estimating movements in the Beveridge curve and the job creation curve from 12/01/2007 to 08/01/2009. Pictured below are my results.
Figure F: Labor demand did dominate any movements in the unemployment rate during the recession

The first job creation curve has a slope θ = .5272 which is the mean of labor market tightness observations from 12/01/2007 to 05/01/2008. The second job creation curve has a slope θ = .16194 which is the mean of labor market tightness observations from 03/01/2009 to 08/01/2009. The power function was chosen to estimate the two Beveridge curves. For the complete details on how I derive the job creation and Beveridge curves please refer to my paper which can be found in the first post on the modern job search and matching theory of unemployment.
Figure F clearly shows that the increase in unemployment quite overwhelmingly stemmed from labor demand conditions as embodied by the downward rotation of the job creation curve. Notice that the Beveridge curve failed to shift in any significant way over this time period.
To leave a comment for the author, please follow the link and comment on their blog: The Dancing Economist.
R-bloggers.com offers daily e-mail updates about R news and tutorials about learning R and many other topics. Click here if you're looking to post or find an R/data-science job.
Want to share your content on R-bloggers? click here if you have a blog, or here if you don't.