
Happy Pi Day, Now Go Estimate It!
Want to share your content on R-bloggers? click here if you have a blog, or here if you don't.
As you may know, today is Pi Day, when all good nerds take a moment to thank the geeks of antiquity for their painstaking work in estimating this marvelous mathematical constant.
It is also a great opportunity to thank contemporary geeks for the wonders of modern computing, which allow us to estimate pi to near infinite precision. One popular method for estimating pi is the so-called “random darts method,” which uses the Monte Carlo method to simulate the act of throwing darts at a board centered inside a square. Suppose we have a dartboard ascribed in a square as pictured below.

If we randomly throw darts at this board such that each dart has an equal probability of landing on the board or outside it, then we can estimate pi using the ratio of darts that fall inside the circle. In this case, those would be the darts in the red shaded area below.
Specifically, our estimate for pi will be four times the number of darts on the board divided by the total number of throws. Again, we are assuming all darts hit the square and have equal probability of landing anywhere inside the square, i.e., a very bad dart thrower.
Using this method, it is extremely easy to estimate a value of pi using Monte Carlo in R. We simply need to make N number of draws in two dimensions from a uniform distributions, test which points are on the board, and then estimate pi with that ratio.
This can be accomplished in six lines of R code (ignoring comments):
If we want to have a lot of fun, we can test for convergence to pi as the number of dart throws gets big. Since the Monte Carlo method relies on the law of large numbers, we would expect the precision of our estimate to increase as the number of darts thrown increases. In other words, the more of the board we can potentially cover, the better our estimate will be.
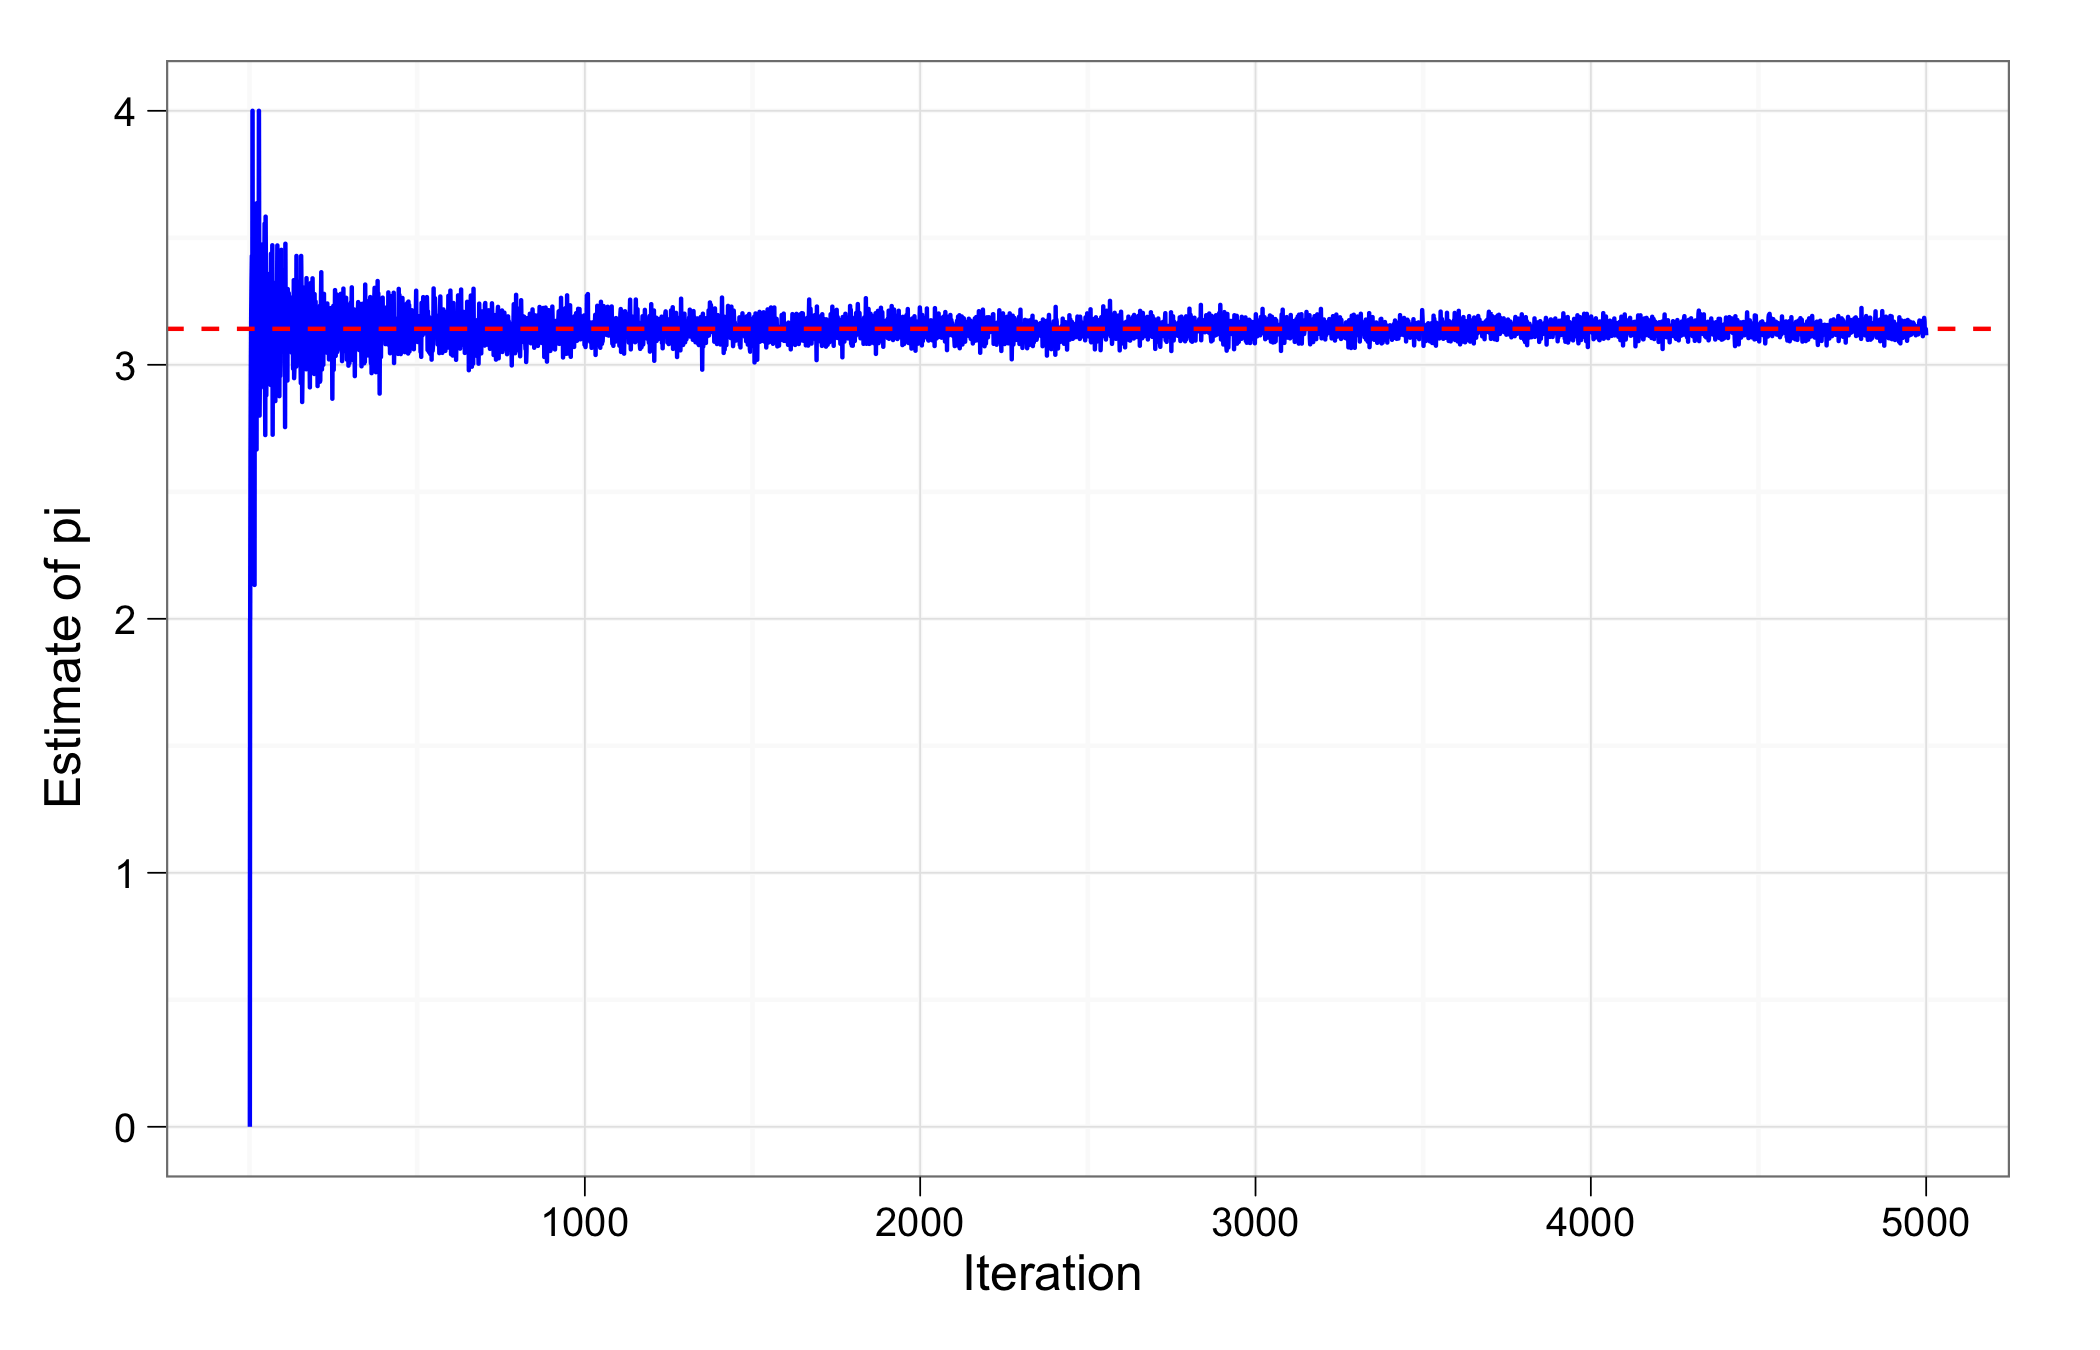
I ran the simulation from 1 to 5,000 trials, and as you can see from the above chart the estimate quickly converges to a value within a fraction of pi. The circle diagrams I used above were taken from this great tutorial on estimating pi in Python, so you can have fun estimating pi in many languages.
Challenge: submit code for estimating pi using Monte Carlo in your favorite, or most esoteric, language. Bonus points for brevity and elegance—especially if you can improve on my above code.
R-bloggers.com offers daily e-mail updates about R news and tutorials about learning R and many other topics. Click here if you're looking to post or find an R/data-science job.
Want to share your content on R-bloggers? click here if you have a blog, or here if you don't.