
Technical(and not technical) strategy testing
[This article was first published on Quant-Day, and kindly contributed to R-bloggers]. (You can report issue about the content on this page here)
Want to share your content on R-bloggers? click here if you have a blog, or here if you don't.
I got “hooked” on OOP approach of R in particular reference classes. And after my last little project on option scenario analysis I reconstructed my messy technical strategy testing code.Want to share your content on R-bloggers? click here if you have a blog, or here if you don't.
Now to begin I would like to reason why I have done this while there exists a nice “blotter” and “quantstrat” packages.
First of all “quantstrat” is faster than blotter, which is good. However it was not good enough for me. Once you have 1 minute data and you want to optimise a strategy on 1 year data you can leave your code running for a few days, what is not very convenient as your strategy could be worth absolutely nothing while spending so much time on it. I would also like to note, that the bigger the matrix, the slower the script runs, speaking in relative terms of course. And this is general tendency for R. So I found that 1 minute data is best to test on 1 month minute data without causing too much inconvenience. Of course you will not get away with it once you found a good strategy… and really hurts to see how your code slows down by a significant multiplier once you double the size of your observations. Solution might be to split your data into parts(which just came to my mind while writing this), but then you loose few trades and have to work out your reconstruction, which might be messy with a slight loss in testing “robustness”.
Secondly, I want to tell what I think the advantages against Meta stock or other backtesting software are. Answer is simple: machine learning, garch, nlm, no limits. Disadvantages: loss of speed. Another idea which just came to my mind is to write the main loop in Cpp! And given my approach it is feasible!
And my approach is simple and similar to “quantstrat”. Also I got few ideas from my friend who is using Meta Stock(in terms of structuring my code). The speed benefit comes from the fact that it is maintained as simple as possible to get the required result.
GIT REPOSITORY:
https://github.com/afraid2trade/fast_strat.git
So lets see an example. Gist is embedded above, however I will explain it in some detail:
1. load your data with OHLC(column names will be converted to “open”, “high”, “open”, “close” for simplicity.
data = dbase(0, 1)
X = to.minutes(data)[“201201”]
> dim(X)
[1] 31680 4
2. initialise your reference main class:
stra = Strat(data=X)
args(Strat)
function (data, init = 10000, qty = 5 * init, spread = 2)
data – OHLC (xts class)
qty – trading position
spread – FX spread
> class(stra)
[1] “tstrat”
23 methods, of which 11 are possibly relevant:
ind, l.entry, l.exit, names, plot, run, s.entry, s.exit, signal, time
ind – add your indicator
signal – define your signal
time – on which weekdays and at what time you want to trade
> args(stra$time)
function (from = 0, to = 23, days = 2:6)
l.entry, l.exit, s.entry, s.exit – all have same arguments
> args(stra$l.entry)
function (columns, true)
columns – names of columns of signals
true – vector of TRUE FALSE indicating which signals you prefer true, which false
3. Add your indicators:
stra$ind(fun=SMA, name=”smaf”, n=20, prefun=Cl)
stra$ind(fun=SMA, name=”smas”, n=50, prefun=Cl)
4. Add your signals:
stra$signal(name=”crossup”, type=”cross”, col1=”smaf”, col2=”smas”)
stra$signal(name=”crossdown”, type=”cross”, col1=”smas”, col2=”smaf”)
5. Add your entry exit conditions based on signals:
stra$l.entry(“crossup”,1)
stra$l.exit(“crossdown”,1)
stra$s.entry(“crossdown”,1)
stra$s.exit(“crossup”,1)
6. Run the code! Note the dimensions of given “X” matrix.
stra$run()
On my 3 year old macbook pro it took no more than 3 minutes(given that matlab inbuilt test rated my laptop performance to be lowest among all benchmarks it looks good. doesnt it?)
This is a result of the fact that in the loop I used as little objects as possible and have split them to multiple matrices to reduce their size what makes R deal with them faster.
7. Plot results!
stra$plot()
addSMA(20)
addSMA(50)
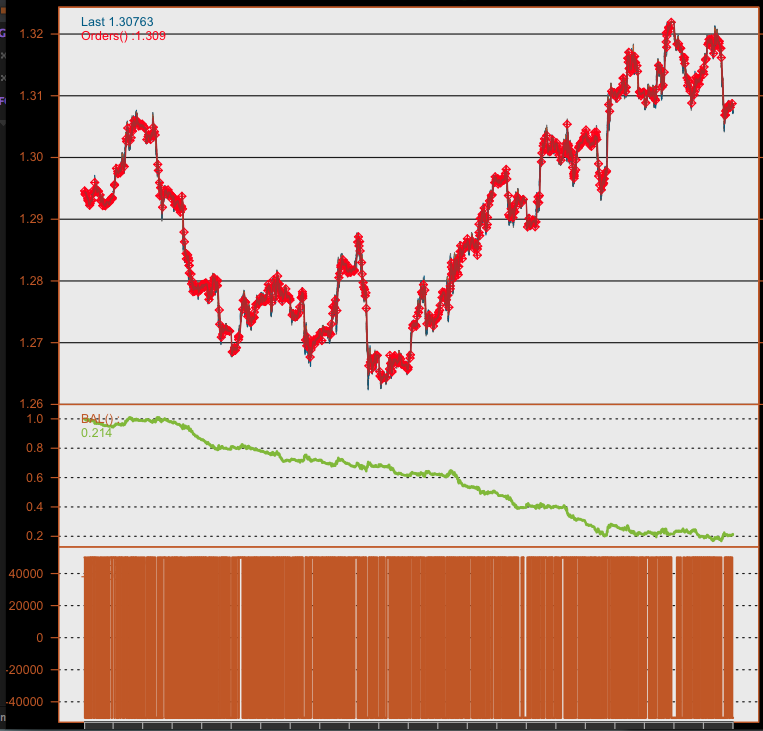
It contains:
a) charted series with red dots where trades has occurred
b) wealth index
c) position at the time
8. Your data with all indicators, returns, etc can be accessed:
stra$data
str(stra$data)
ret = stra$data$ret
Good things(as Q&A):
1. How many lines I need to do all of this? 16(including 1 line to initialise and 2 lines to load the data).
2. Do I have numerous arguments for each function? No.
3. Does the framework work? Try yourself.
Bad things:
I lost 80% of my initial capital with this strategy.
That is about it. Looks simple, but you can do anything you want without complicated structures. What I mean is I liked “quantstrat”, however it took me few days to grasp what is going. Also, it has a lot of functionality that I have not used and finally functionality that I wanted to use was not there, while now I have my simple code that I can manipulate.
My plans for future regarding this little project:
1. Add simple stop loss methods.
2. Make it more general in terms of defining tax and spread functions.
3. Include better position management
4. Edit the aggregation of terminal results: i.e. dealing with trading prices(close or next period open, which day P&L will it represent etc)
5. Refine the code to give the right errors in right places
6. Rewrite the terminal loop in Cpp. Loop currently contains 42 lines and might expand to, i think, 60 after stop loss inclusion. Cpp should not take more than 150 lines
Once again, feedback and comments are welcome.
To leave a comment for the author, please follow the link and comment on their blog: Quant-Day.
R-bloggers.com offers daily e-mail updates about R news and tutorials about learning R and many other topics. Click here if you're looking to post or find an R/data-science job.
Want to share your content on R-bloggers? click here if you have a blog, or here if you don't.