Stop and Frisk: Blacks stopped 3-6 times more than Whites over 10 years
Want to share your content on R-bloggers? click here if you have a blog, or here if you don't.
The NYPD provides publicly available data on stop and frisks with data dictionaries, located here. The data, ranging from 2003 to 2014, contains information on over 4.5 million stops. Several variables such as the age, sex, and race of the person stopped are included.
I wrote some R code to clean and compile the data into a single .RData file. The code and clean data set are available in my Github repository.
Here are some preliminary descriptive statistics:
The data shows some interesting trends:
- Stops had been increasing steadily from 2003 to 2012, but falling since 2012.
- The percentage of stopped persons who were black was consistently 3.5-6.5 times higher than the percentage of stopped persons who were white.
- The data indicates whether or not officers explained the reason for stop to the stopped person. The data shows that police gave an explanation about 98-99% of the time. Of course, this involves a certain level of trust since the data itself is recorded by police. There is no difference in this statistic across race and sex.
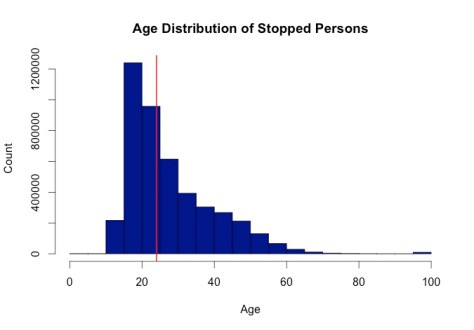
- The median age of stopped persons was 24. The distribution was roughly the same across race and sex.
A few notes on the data:
- The raw data is saved as CSV files, one file for each year. However, the same variables are not tracked in each year. The .RData file on Github only contains select variables.
- The importing and cleaning codes can take about 15 minutes to run.
- All stops in all years have coordinates marking the location of the stop, however I’m still unable to make sense of them. I plan to publish another post with some spatial analyses.
The coding for this was particularly interesting because I had never used R to download ZIP files from the web. I reproduced this portion of the code below. It produces one dataset for each year from 2013 to 2014.
for(i in 2013:2014){
 temp <- tempfile()
 url<-paste("http://www.nyc.gov/html/nypd/downloads/zip/analysis_and_planning/",i,"_sqf_csv.zip",sep='')
 download.file(url,temp)
 assign(paste("d",i,sep=''),read.csv(unz(temp, paste(i,".csv",sep=''))))
}
unlink(temp)
R-bloggers.com offers daily e-mail updates about R news and tutorials about learning R and many other topics. Click here if you're looking to post or find an R/data-science job.
Want to share your content on R-bloggers? click here if you have a blog, or here if you don't.


