
Algorithmic Trading: Using Quantopian’s Zipline Python Library In R And Backtest Optimizations By Grid Search And Parallel Processing
Want to share your content on R-bloggers? click here if you have a blog, or here if you don't.
We are ready to demo our new new experimental package for Algorithmic Trading, flyingfox, which uses reticulate to to bring Quantopian’s open source algorithmic trading Python library, Zipline, to R. The flyingfox library is part of our NEW Business Science Labs innovation lab, which is dedicated to bringing experimental packages to our followers early on so they can test them out and let us know what they think before they make their way to CRAN. This article includes a long-form code tutorial on how to perform backtest optimizations of trading algorithms via grid search and parallel processing. In this article, we’ll show you how to use the combination of tibbletime (time-based extension of tibble) + furrr (a parallel-processing compliment to purrr) + flyingfox (Zipline in R) to develop a backtested trading algorithm that can be optimized via grid search and parallel processing. We are releasing this article as a compliment to the R/Finance Conference presentation “A Time Series Platform For The Tidyverse”, which Matt will present on Saturday (June 2nd, 2018). Enjoy!
New: Business Science Labs
I (Davis) am excited to introduce a new open source initiative called Business Science Labs. A lot of the experimental work we do is done behind the scenes, and much of it you don’t see early on. What you do see is a “refined” version of what we think you need based on our perception, which is not always reality. We aim to change this. Starting today, we have created Business Science Labs, which is aimed at bringing our experimental software to you earlier so you can test it out and let us know your thoughts!
Our first initiative is to bring Quantopian’s Open Source algorithmic trading Python library, Zipline, to R via an experimental package called flyingfox (built using the awesome reticulate package).
What We’re Going To Learn
Introducing Business Science Labs is exciting, but we really want to educate you on some new packages! In this tutorial, we are going to go over how to backtest algorithmic trading strategies using parallel processing and Quantopian’s Zipline infrastructure in R. You’ll gain exposure to a tibbletime, furrr, and our experimental flyingfox package. The general progression is:
-
tibbletime: What it is and why it’s essential to performing scalable time-based calculations in thetidyverse -
furrr: Why you need to know this package for speeding up code by processingpurrrin parallel -
flyingfox: The story behind the package, and how you can use it to test algorithmic trading strategies -
tibbletime+furrr+flyingfox: Putting it all together to perform parallelized algorithmic trading strategies and analyze time-based performance
Here’s an example of the grid search we perform to determine which are the best combinations of short and long moving averages for the stock symbol JPM (JP Morgan).

Here’s an example of the time series showing the order (buy/sell) points determined by the moving average crossovers, and the effect on the portfolio value.

Algorithmic Trading Strategies And Backtesting
Algorithmic trading is nothing new. Financial companies have been performing algorithmic trading for years as a way of attempting to “beat” the market. It can be very difficult to do, but some traders have successfully applied advanced algorithms to yield significant profits.
Using an algorithm to trade boils down to buying and selling. In the simplest case, when an algorithm detects an asset (a stock) is going to go higher, a buy order is placed. Conversely, when the algorithm detects that an asset is going to go lower, a sell order is placed. Positions are managed by buying and selling all or part of the portfolio of assets. To keep things simple, we’ll focus on just the full buy/sell orders.
One very basic method of algorithmic trading is using short and long moving averages to detect shifts in trend. The crossover is the point where a buy/sell order would take place. The figure below shows the price of Halliburton (symbol “HAL”), which a trader would have an initial position in of say 10,000 shares. In a hypothetical case, the trader could use a combination of a 20 day short moving average and a 150 day long moving average and look for buy/sell points at the crossovers. If the trader hypothetically sold his/her position in full on the sell and bought the position back in full, then the trader would stand to avoid a delta loss of approximately $5/share during the downswing, or $50,000.

Backtesting is a strategy that is used to detect how a trading strategy would have performed in the past. It’s impossible to know what the future will bring, but using trading strategies that work in the past helps to instill confidence in an algorithm.
Quantopian is a platform designed to enable anyone to develop algorithmic trading strategies. To help its community, Quantopian provides several open source tools. The one we’ll focus on is Zipline for backtesting. There’s one downside: it’s only available in Python.
With the advent of the reticulate package, which enables porting any Python library to R, we took it upon ourselves to test out the viability of porting Zipline to R. Our experiment is called flyingfox.
RStudio Cloud Experiment Sandbox
In this code-based tutorial, we’ll use an experimental package called flyingfox. It has several dependencies including Python that require setup time and effort. For those that want to test out flyingfox quickly, we’ve created a FREE RStudio Cloud Sandbox for running experiments. You can access the Cloud Sandbox here for FREE: https://rstudio.cloud/project/38291

Packages Needed For Backtest Optimization
The meat of this code-tutorial is the section Backtest Optimization Using tibbletime + furrr + flyingfox . However, before we get to it, we’ll go over the three main packages used to do high-performance backtesting optimizations:
-
tibbletime: What it is, and why it’s essential to performing scalable time-based calculations in thetidyverse -
furrr: Why you need to know this package for speeding up code by processingpurrrin parallel -
flyingfox: How to use it to test algorithmic trading strategies
Putting It All Together: tibbletime + furrr + flyingfox for backtesting optimizations performed using parallel processing and grid search!
Install & Load Libraries
Install Packages
For this post, you’ll need to install development version of flyingfox.
devtools::install_github("DavisVaughan/flyingfox")If you are on windows, you should also install the development version of furrr.
devtools::install_github("DavisVaughan/furrr")Other packages you’ll need include tibbletime, furrr, and tidyverse. We’ll also load tidyquant mainly for the ggplot2 themes. We’ll install ggrepel to repel overlapping plot labels. You can install these from CRAN using install.packages().
Load Packages
library(tidyverse)
library(tibbletime)
library(furrr)
library(flyingfox)
library(tidyquant)
library(ggrepel)
We’ll cover how a few packages work before jumping into backtesting and optimizations.
1. tibbletime
The tibbletime package is a cornerstone for future time series software development efforts at Business Science. We have major plans for this package. Here are some key benefits:
- Time periods down to milliseconds are supported
- Because this is a
tibbleunder the hood, we are able to leverage existing packages for analysis without reinventing the wheel - Scalable grouped analysis is at your fingertips because of
collapse_by()and integration withgroup_by()
It’s best to learn now, and we’ll go over the basics along with a few commonly used functions: collapse_by(), rollify(), filter_time(), and as_period().
First, let’s get some data. We’ll use the FANG data set that comes with tibbletime, which includes stock prices for FB, AMZN, NFLX, and GOOG. We recommend using the tidyquant package to get this or other stock data.
data("FANG")

FANG
## # A tibble: 4,032 x 8
## symbol date open high low close volume adjusted
## <chr> <date> <dbl> <dbl> <dbl> <dbl> <dbl> <dbl>
## 1 FB 2013-01-02 27.4 28.2 27.4 28 69846400 28
## 2 FB 2013-01-03 27.9 28.5 27.6 27.8 63140600 27.8
## 3 FB 2013-01-04 28.0 28.9 27.8 28.8 72715400 28.8
## 4 FB 2013-01-07 28.7 29.8 28.6 29.4 83781800 29.4
## 5 FB 2013-01-08 29.5 29.6 28.9 29.1 45871300 29.1
## 6 FB 2013-01-09 29.7 30.6 29.5 30.6 104787700 30.6
## 7 FB 2013-01-10 30.6 31.5 30.3 31.3 95316400 31.3
## 8 FB 2013-01-11 31.3 32.0 31.1 31.7 89598000 31.7
## 9 FB 2013-01-14 32.1 32.2 30.6 31.0 98892800 31.0
## 10 FB 2013-01-15 30.6 31.7 29.9 30.1 173242600 30.1
## # ... with 4,022 more rowsNext, you’ll need to convert thistbl_df object to a tbl_time object using the tbl_time() function.
FANG_time <- FANG %>%
  tbl_time(date) %>%
  group_by(symbol)

FANG_time
## # A time tibble: 4,032 x 8
## # Index: date
## # Groups: symbol [4]
## symbol date open high low close volume adjusted
## <chr> <date> <dbl> <dbl> <dbl> <dbl> <dbl> <dbl>
## 1 FB 2013-01-02 27.4 28.2 27.4 28 69846400 28
## 2 FB 2013-01-03 27.9 28.5 27.6 27.8 63140600 27.8
## 3 FB 2013-01-04 28.0 28.9 27.8 28.8 72715400 28.8
## 4 FB 2013-01-07 28.7 29.8 28.6 29.4 83781800 29.4
## 5 FB 2013-01-08 29.5 29.6 28.9 29.1 45871300 29.1
## 6 FB 2013-01-09 29.7 30.6 29.5 30.6 104787700 30.6
## 7 FB 2013-01-10 30.6 31.5 30.3 31.3 95316400 31.3
## 8 FB 2013-01-11 31.3 32.0 31.1 31.7 89598000 31.7
## 9 FB 2013-01-14 32.1 32.2 30.6 31.0 98892800 31.0
## 10 FB 2013-01-15 30.6 31.7 29.9 30.1 173242600 30.1
## # ... with 4,022 more rowscollapse_by()
Beautiful. Now we have a time-aware tibble. Let’s test out some functions. First, let’s take a look at collapse_by(), which is used for grouped operations. We’ll collapse by “year”, and calculate the average price for each of the stocks.
FANG_time %>%
  collapse_by(period = "year") %>%
  group_by(symbol, date) %>%
  summarise(mean_adj = mean(adjusted))
## # A time tibble: 16 x 3
## # Index: date
## # Groups: symbol [?]
## symbol date mean_adj
## <chr> <date> <dbl>
## 1 AMZN 2013-12-31 298.
## 2 AMZN 2014-12-31 333.
## 3 AMZN 2015-12-31 478.
## 4 AMZN 2016-12-30 700.
## 5 FB 2013-12-31 35.5
## 6 FB 2014-12-31 68.8
## 7 FB 2015-12-31 88.8
## 8 FB 2016-12-30 117.
## 9 GOOG 2013-12-31 442.
## 10 GOOG 2014-12-31 561.
## 11 GOOG 2015-12-31 602.
## 12 GOOG 2016-12-30 743.
## 13 NFLX 2013-12-31 35.3
## 14 NFLX 2014-12-31 57.5
## 15 NFLX 2015-12-31 91.9
## 16 NFLX 2016-12-30 102.rollify()
Next, let’s take a look at rollify(). Remember the chart of Halliburton prices at the beginning. It was created using rollify(), which turns any function into a rolling function. Here’s the code for the chart. Notice how we create two rolling functions using mean() and supplying the appropriate window argument.
hal_tbl <- tq_get("HAL", from = "2016-01-01", to = "2017-12-31")

roll_20  <- rollify(mean, window = 20)
roll_150 <- rollify(mean, window = 150)

hal_ma_tbl <- hal_tbl %>%
    select(date, adjusted) %>%
    mutate(
        ma_20  = roll_20(adjusted),
        ma_150 = roll_150(adjusted)
    ) %>%
    gather(key = key, value = value, -date, factor_key = T)

hal_ma_tbl %>%
    ggplot(aes(date, value, color = key, linetype = key)) +
    geom_line() +
    theme_tq() +
    scale_color_manual(values = c(palette_light()[[1]], "blue", "red")) +
    labs(title = "Halliburton Asset Price (HAL)",
         subtitle = "Strategy: Short MA = 20, Long MA = 150",
         x = "Date", y = "Adjusted Stock Price") +
    annotate("point", x = as_date("2017-04-07"), y = 49.25, colour = "red", size = 5) +
    annotate("text", label = "Sell Signal",
             x = as_date("2017-04-07"), y = 49.25 + 2.5, color = "red", hjust = 0) +
    annotate("point", x = as_date("2017-10-09"), y = 44.25, colour = "blue", size = 5) +
    annotate("text", label = "Buy Signal",
             x = as_date("2017-10-09"), y = 44.25 + 2.5, color = "blue")
filter_time()
Let’s check out filter_time(), which enables easier subsetting of time-based indexes. Let’s redo the chart above, instead focusing in on sell and buy signals, which occur after February 2017. We can convert the previously stored hal_ma_tbl to a tbl_time object, group by the “key” column, and then filter using the time function format filter_time("2017-03-01" ~ "end"). We then reuse the plotting code above.
hal_ma_time <- hal_ma_tbl %>%
    as_tbl_time(date) %>%
    group_by(key)

hal_ma_time %>%

    filter_time("2017-03-01" ~ "end") %>%

    ggplot(aes(date, value, color = key, linetype = key)) +
    geom_line() +
    theme_tq() +
    scale_color_manual(values = c(palette_light()[[1]], "blue", "red")) +
    labs(title = "Halliburton Asset Price (HAL)", subtitle = "2016 through 2017",
         x = "Date", y = "Adjusted Stock Price") +
    annotate("point", x = as_date("2017-04-07"), y = 49.25, colour = "red", size = 5) +
    annotate("text", label = "Sell Signal",
             x = as_date("2017-04-07"), y = 49.25 + 2.5, color = "red", hjust = 0) +
    annotate("point", x = as_date("2017-10-09"), y = 44.25, colour = "blue", size = 5) +
    annotate("text", label = "Buy Signal",
             x = as_date("2017-10-09"), y = 44.25 + 2.5, color = "blue")
as_period()
We can use the as_period() function to change the periodicity to a less granular level (e.g. going from daily to monthly). Here we convert the HAL share prices from daily periodicity to monthly periodicity.
hal_ma_time %>%

    as_period(period = "monthly", side = "end") %>%

    ggplot(aes(date, value, color = key, linetype = key)) +
    geom_line() +
    theme_tq() +
    scale_color_manual(values = c(palette_light()[[1]], "blue", "red")) +
    labs(title = "Halliburton Asset Price (HAL)",
         subtitle = "Periodicity Changed To Monthly",
         x = "Date", y = "Adjusted Stock Price")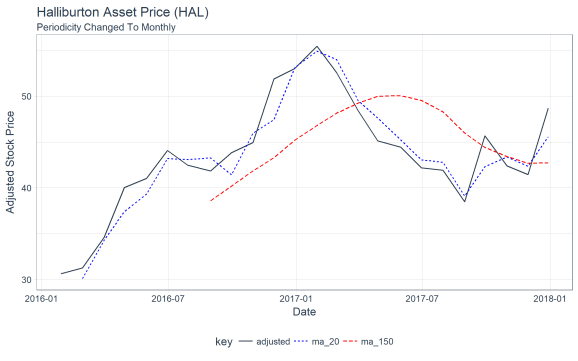
Next, let’s check out a new package for parallel processing using purrr: furrr!
2. furrr
The furrr package combines the awesome powers of future for parallel processing with purrr for iteration. Let’s break these up into pieces by purrr, future, and furrr.
purrr
The purrr package is used for iteration over a number of different types of generic objects in R, including vectors, lists, and tibbles. The main function used is map(), which comes in several varieties (e.g. map(), map2(), pmap(), map_chr(), map_lgl(), map_df(), etc). Here’s a basic example to get the class() of the columns of the FANG_time variable. Using map() iterates over the columns of the data frame returning a list containing the contents of the function applied to each column.
FANG_time %>%
    map(class)
## $symbol
## [1] "character"
##
## $date
## [1] "Date"
##
## $open
## [1] "numeric"
##
## $high
## [1] "numeric"
##
## $low
## [1] "numeric"
##
## $close
## [1] "numeric"
##
## $volume
## [1] "numeric"
##
## $adjusted
## [1] "numeric"future
The future package enables parallel processing. Here are a few important points:
-
futureis a unified interface for parallel programming in R. -
You set a “plan” for how code should be executed, call
future()with an expression to evaluate, and callvalue()to retrieve the value. The firstfuture()call sends off the code to another R process and is non-blocking so you can keep running R code in this session. It only blocks once you callvalue(). -
Global variables and packages are automatically identified and exported for you!
Now, the major point: If you’re familiar with purrr, you can take advantage of future parallel processing with furrr!
furrr = future + purrr
furrr takes the best parts of purrr and combines it with the parallel processing capabilities of future to create a powerful package with an interface instantly familiar to anyone who has used purrr before. All you need to do is two things:
-
Setup a
plan()such asplan("multiprocess") -
Change
map()(or otherpurrrfunction) tofuture_map()(or other compatiblefurrrfunction)
Every purrr function has a compatible furrr function. For example,
map_df() has future_map_df(). Set a plan, and run future_map_df() and that is all there
is to it!
furrr Example: Multiple Moving Averages
Say you would like to process not a single moving average but multiple moving averages for a given data set. We can create a custom function, multi_roller(), that uses map_dfc() to iteratively map a rollify()-ed mean() based on a sequence of windows. Here’s the function and how it works when a user supplies a data frame, a column in the data frame to perform moving averages, and a sequence of moving averages.
multi_roller <- function(data, col, ..f = mean,
                         window = c(10, 20, 30, 100, 200), sep = "V_") {

    col_expr <- enquo(col)

    ret_tbl <- window %>%
        set_names(~ paste0(sep, window)) %>%
        map_dfc(~ rollify(..f, window = .x)(pull(data, !! col_expr))) %>%
        bind_cols(data, .)

    return(ret_tbl)

}
We can test the function out with the FB stock prices from FANG. We’ll ungroup, filter by FB, and select the important columns, then pass the data frame to the multi_roller() function with window = seq(10, 100, by = 10). Great, it’s working!
FANG_time %>%
    ungroup() %>%
    filter(symbol == "FB") %>%
    select(symbol, date, adjusted) %>%
    multi_roller(adjusted, mean, window = seq(10, 100, by = 10), sep = "ma_")
## # A time tibble: 1,008 x 13
## # Index: date
## symbol date adjusted ma_10 ma_20 ma_30 ma_40 ma_50 ma_60
## <chr> <date> <dbl> <dbl> <dbl> <dbl> <dbl> <dbl> <dbl>
## 1 FB 2013-01-02 28 NA NA NA NA NA NA
## 2 FB 2013-01-03 27.8 NA NA NA NA NA NA
## 3 FB 2013-01-04 28.8 NA NA NA NA NA NA
## 4 FB 2013-01-07 29.4 NA NA NA NA NA NA
## 5 FB 2013-01-08 29.1 NA NA NA NA NA NA
## 6 FB 2013-01-09 30.6 NA NA NA NA NA NA
## 7 FB 2013-01-10 31.3 NA NA NA NA NA NA
## 8 FB 2013-01-11 31.7 NA NA NA NA NA NA
## 9 FB 2013-01-14 31.0 NA NA NA NA NA NA
## 10 FB 2013-01-15 30.1 29.8 NA NA NA NA NA
## # ... with 998 more rows, and 4 more variables: ma_70 <dbl>,
## # ma_80 <dbl>, ma_90 <dbl>, ma_100 <dbl>We can apply this multi_roller() function to a nested data frame. Let’s try it on our FANG_time data set. We’ll select the columns of interest (symbol, date, and adjusted), group by symbol, and use the nest() function to get the data nested.
FANG_time_nested <- FANG_time %>%
    select(symbol, date, adjusted) %>%
    group_by(symbol) %>%
    nest()

FANG_time_nested
## # A tibble: 4 x 2
## symbol data
## <chr> <list>
## 1 FB <tibble [1,008 x 2]>
## 2 AMZN <tibble [1,008 x 2]>
## 3 NFLX <tibble [1,008 x 2]>
## 4 GOOG <tibble [1,008 x 2]>Next, we can perform a rowwise map using the combination of mutate() and map(). We apply multi_roller() as an argument to map() along with data (variable being mapped), and the additional static arguments, col and window.
FANG_time_nested %>%
    mutate(ma = map(data, multi_roller, col = adjusted, ..f = mean,
                    window = seq(10, 100, by = 10), sep = "ma_")) %>%
    select(-data) %>%
    unnest()
## # A time tibble: 4,032 x 13
## # Index: date
## symbol date adjusted ma_10 ma_20 ma_30 ma_40 ma_50 ma_60
## <chr> <date> <dbl> <dbl> <dbl> <dbl> <dbl> <dbl> <dbl>
## 1 FB 2013-01-02 28 NA NA NA NA NA NA
## 2 FB 2013-01-03 27.8 NA NA NA NA NA NA
## 3 FB 2013-01-04 28.8 NA NA NA NA NA NA
## 4 FB 2013-01-07 29.4 NA NA NA NA NA NA
## 5 FB 2013-01-08 29.1 NA NA NA NA NA NA
## 6 FB 2013-01-09 30.6 NA NA NA NA NA NA
## 7 FB 2013-01-10 31.3 NA NA NA NA NA NA
## 8 FB 2013-01-11 31.7 NA NA NA NA NA NA
## 9 FB 2013-01-14 31.0 NA NA NA NA NA NA
## 10 FB 2013-01-15 30.1 29.8 NA NA NA NA NA
## # ... with 4,022 more rows, and 4 more variables: ma_70 <dbl>,
## # ma_80 <dbl>, ma_90 <dbl>, ma_100 <dbl>Great, we have our moving averages. But…
What if instead of 10 moving averages, we had 500? This would take a really long time to run on many stocks. Solution: Parallelize with furrr!
There are two ways we could do this since there are two maps:
- Parallelize the
map()internal to themulti_roller()function - Parallelize the rowwise
map()applied to each symbol
We’ll choose the former (1) to show off furrr.
To make the multi_roller_parallel() function, copy the multi_roller() function and do 2 things:
- Add
plan("multiprocess")at the beginning - Change
map_dfc()tofuture_map_dfc()
That’s it!
multi_roller_parallel <- function(data, col, ..f = mean,
                                  window = c(10, 20, 30, 100, 200),
                                  sep = "V_") {

    plan("multiprocess")

    col_expr <- enquo(col)

    ret_tbl <- window %>%
        set_names(~ paste0(sep, window)) %>%
        future_map_dfc(~ rollify(..f, window = .x)(pull(data, !! col_expr))) %>%
        bind_cols(data, .)

    return(ret_tbl)

}
In the previous rowwise map, switch out multi_roller() for multi_roller_parallel() and change the window = 2:500. Sit back and let the function run in parallel using each of your computer cores.
FANG_time_nested %>%
    mutate(ma = map(data, multi_roller_parallel, col = adjusted,
                    ..f = mean, window = 2:500, sep = "ma_")) %>%
    select(-data) %>%
    unnest()
## # A time tibble: 4,032 x 502
## # Index: date
## symbol date adjusted ma_2 ma_3 ma_4 ma_5 ma_6 ma_7
## <chr> <date> <dbl> <dbl> <dbl> <dbl> <dbl> <dbl> <dbl>
## 1 FB 2013-01-02 28 NA NA NA NA NA NA
## 2 FB 2013-01-03 27.8 27.9 NA NA NA NA NA
## 3 FB 2013-01-04 28.8 28.3 28.2 NA NA NA NA
## 4 FB 2013-01-07 29.4 29.1 28.6 28.5 NA NA NA
## 5 FB 2013-01-08 29.1 29.2 29.1 28.8 28.6 NA NA
## 6 FB 2013-01-09 30.6 29.8 29.7 29.5 29.1 28.9 NA
## 7 FB 2013-01-10 31.3 30.9 30.3 30.1 29.8 29.5 29.3
## 8 FB 2013-01-11 31.7 31.5 31.2 30.7 30.4 30.1 29.8
## 9 FB 2013-01-14 31.0 31.3 31.3 31.1 30.7 30.5 30.3
## 10 FB 2013-01-15 30.1 30.5 30.9 31.0 30.9 30.6 30.4
## # ... with 4,022 more rows, and 493 more variables: ma_8 <dbl>,
## # ma_9 <dbl>, ma_10 <dbl>, ma_11 <dbl>, ma_12 <dbl>, ma_13 <dbl>,
## # ma_14 <dbl>, ma_15 <dbl>, ma_16 <dbl>, ma_17 <dbl>, ma_18 <dbl>,
## # ma_19 <dbl>, ma_20 <dbl>, ma_21 <dbl>, ma_22 <dbl>, ma_23 <dbl>,
## # ma_24 <dbl>, ma_25 <dbl>, ma_26 <dbl>, ma_27 <dbl>, ma_28 <dbl>,
## # ma_29 <dbl>, ma_30 <dbl>, ma_31 <dbl>, ma_32 <dbl>, ma_33 <dbl>,
## # ma_34 <dbl>, ma_35 <dbl>, ma_36 <dbl>, ma_37 <dbl>, ma_38 <dbl>,
## # ma_39 <dbl>, ma_40 <dbl>, ma_41 <dbl>, ma_42 <dbl>, ma_43 <dbl>,
## # ma_44 <dbl>, ma_45 <dbl>, ma_46 <dbl>, ma_47 <dbl>, ma_48 <dbl>,
## # ma_49 <dbl>, ma_50 <dbl>, ma_51 <dbl>, ma_52 <dbl>, ma_53 <dbl>,
## # ma_54 <dbl>, ma_55 <dbl>, ma_56 <dbl>, ma_57 <dbl>, ma_58 <dbl>,
## # ma_59 <dbl>, ma_60 <dbl>, ma_61 <dbl>, ma_62 <dbl>, ma_63 <dbl>,
## # ma_64 <dbl>, ma_65 <dbl>, ma_66 <dbl>, ma_67 <dbl>, ma_68 <dbl>,
## # ma_69 <dbl>, ma_70 <dbl>, ma_71 <dbl>, ma_72 <dbl>, ma_73 <dbl>,
## # ma_74 <dbl>, ma_75 <dbl>, ma_76 <dbl>, ma_77 <dbl>, ma_78 <dbl>,
## # ma_79 <dbl>, ma_80 <dbl>, ma_81 <dbl>, ma_82 <dbl>, ma_83 <dbl>,
## # ma_84 <dbl>, ma_85 <dbl>, ma_86 <dbl>, ma_87 <dbl>, ma_88 <dbl>,
## # ma_89 <dbl>, ma_90 <dbl>, ma_91 <dbl>, ma_92 <dbl>, ma_93 <dbl>,
## # ma_94 <dbl>, ma_95 <dbl>, ma_96 <dbl>, ma_97 <dbl>, ma_98 <dbl>,
## # ma_99 <dbl>, ma_100 <dbl>, ma_101 <dbl>, ma_102 <dbl>,
## # ma_103 <dbl>, ma_104 <dbl>, ma_105 <dbl>, ma_106 <dbl>,
## # ma_107 <dbl>, ...Bam! 500 moving averages run in parallel in fraction of the time it would take running in series.
3. flyingfox
We have one final package we need to demo prior to jumping into our Algorithmic Trading Backtest Optimization: flyingfox.
What is Quantopian?
Quantopian is a company that has setup a community-driven platform for everyone (from traders to home-gamers) enabling development of algorithmic trading strategies. The one downside is they only use Python.
What is Zipline?
Zipline is a Python module open-sourced by Quantopian to help traders back-test their trading algorithms. Here are some quick facts about Quantopian’s Zipline Python module for backtesting algorithmic trading strategies:
-
It is used to develop and backtest financial algorithms using Python.
-
It includes an event-driven backtester (really good at preventing look-ahead bias)
-
Algorithms consist of two main functions:
-
initialize(): You write aninitialize()function that is called once at the beginning of the backtest. This sets up variables for use in the backtest, schedules functions to be called daily, monthly, etc, and let’s you set slippage or commission for the backtest. -
handle_data(): You then write ahandle_data()function that is called once per day (or minute) that implements the trading logic. You can place orders, retrieve historical pricing data, record metrics for performance evalutation and more.
-
-
Extra facts: You can use any Python module inside the handle_data() function, so you have a lot of flexibility here.
What is reticulate?
The reticulate package from RStudio is an interface with Python. It smartly takes care of (most) conversion between R and Python objects.
Can you combine them?
Yes, and that’s exactly what we did. We used reticulate to access the Zipline Python module from R!
What is the benefit to R users?
What if you could write your initialize() and handle_data() functions in R utilizing any financial or time series R package for your analysis and then have them called from Python and Zipline?
Introducing flyingfox: An R interface to Zipline
flyingfox integrates the Zipline backtesting module in R! Further, it takes care of the overhead with creating the main infrastructure functions initialize() and handle_data() by enabling the user to set up:
fly_initialize(): R version of Zipline’sinitialize()fly_handle_data(): R version of Zipline’shandle_data()
flyingfox takes care of passing these functions to Python and Zipline.
Why “Flying Fox”?
Zipline just doesn’t quite make for a good hex sticker. A flying fox is a synonym for zipliners, and it’s hard to argue that this majestic animal wouldn’t create a killer hex sticker.

Getting Started With flyingfox: Moving Average Crossover
Let’s do a Moving Average Crossover example using the following strategy:
- Using JP Morgan (JPM) stock prices
- If the 20 day short-term moving average crosses above the 150 day long-term moving average, buy 100% into JP Morgan
- If 20 day crosses below the 150 day, sell all of the current JPM position
Setup
Setup can take a while and take up some computer space due to ingesting data (which is where Zipline saves every major asset to your computer). We recommend one of two options:
-
No weight option (for people that just want to try it out): Use our
flyingfoxsandbox on RStudio Cloud. You can connect here: https://rstudio.cloud/project/38291 -
Heavy weight option (for people that want to expand and really test it): Follow the instructions on my GitHub page to
fly_ingest()data. The setup and data ingesting process are discussed here: https://github.com/DavisVaughan/flyingfox. Keep in mind that this is still a work in progress. We recommend doing the no weight option as a first start.
Initialize
First, write the R function for initialize(). It must take context as an argument. This is where you store variables used later, which are accessed via context$variable. We’ll store context$i = 0L to initialize the tracking of days, and context$asset = fly_symbol("JPM") to trade the JPM symbol. You can select any symbol that you’d like (provided Quantopian pulls it from Quandl).
fly_initialize <- function(context) {

  # We want to track what day we are on.
  context$i = 0L

  # We want to trade JP Morgan stock
  context$asset = fly_symbol("JPM")
}
Handle Data
Next, write a handle_data() function:
-
This implements the crossover trading algorithm logic
-
In this example we also use
fly_data_history()to retrieve historical data each day for JP Morgan -
We use
fly_order_target_percent()to move to a new percentage amount invested in JP Morgan (if we order1, we want to move to be 100% invested in JP Morgan, no matter where we were before) -
We use
fly_record()to store arbitrary metrics for review later
fly_handle_data <- function(context, data) {

    # Increment day
    context$i <- context$i + 1L

    # While < 20 days of data, return
    if(context$i < 20L) {
        return()
    }

    # Calculate a short term (20 day) moving average
    # by pulling history for the asset (JPM) and taking an average
    short_hist <- fly_data_history(data, context$asset, "price",
                                   bar_count = 20L, frequency = "1d")
    short_mavg <- mean(short_hist)

    # Calculate a long term (150 day) moving average
    long_hist <- fly_data_history(data, context$asset, "price",
                                  bar_count = 150L, frequency = "1d")
    long_mavg <- mean(long_hist)

    # If short > long, go 100% in JPM
    if(short_mavg > long_mavg) {
        fly_order_target_percent(asset = context$asset, target = 1)
    }
    # Else if we hit the crossover, dump all of JPM
    else if (short_mavg < long_mavg) {
        fly_order_target_percent(asset = context$asset, target = 0)
    }

    # Record today's data
    # We record the current JPM price, along with the value of the short and long
    # term moving average
    fly_record(
        JPM = fly_data_current(data, context$asset, "price"),
        short_mavg = short_mavg,
        long_mavg  = long_mavg
    )

}
Run The Algorithm
Finally, run the algorithm from 2013-2016 using fly_run_algorithm().
performance_time <- fly_run_algorithm(
  initialize  = fly_initialize,
  handle_data = fly_handle_data,
  start       = as.Date("2013-01-01"),
  end         = as.Date("2016-01-01")
)
If you got to this point, you’ve just successfully run a single backtest. Let’s review the performance output.
Reviewing The Performance
Let’s glimpse performance_time to see what the results show. It’s a tbl_time time series data frame organized by the “date” column, and there is a ton of information. We’ll focus on:
- date: Time stamp for each point in the performance analysis
- JPM: This is the price of the asset
- short_mavg and long_mavg: These are our moving averages we are using for the buy/sell crossover signals
- portfolio_value: The value of the portfolio at each time point
- transactions: Transactions stored as a list column. The tibble contains a bunch of information that is useful in determining what happened. More information below.
glimpse(performance_time)## Observations: 756
## Variables: 41
## $ date <dttm> 2013-01-02 21:00:00, 2013-01-03 ...
## $ JPM <dbl> NaN, NaN, NaN, NaN, NaN, NaN, NaN...
## $ algo_volatility <dbl> NaN, 0.00000000, 0.00000000, 0.00...
## $ algorithm_period_return <dbl> 0.00000000, 0.00000000, 0.0000000...
## $ alpha <dbl> NaN, NaN, NaN, NaN, NaN, NaN, NaN...
## $ benchmark_period_return <dbl> 0.003691629, 0.007396885, 0.01111...
## $ benchmark_volatility <dbl> NaN, 0, 0, 0, 0, 0, 0, 0, 0, 0, 0...
## $ beta <dbl> NaN, NaN, NaN, NaN, NaN, NaN, NaN...
## $ capital_used <dbl> 0.000, 0.000, 0.000, 0.000, 0.000...
## $ ending_cash <dbl> 10000.0000, 10000.0000, 10000.000...
## $ ending_exposure <dbl> 0.00, 0.00, 0.00, 0.00, 0.00, 0.0...
## $ ending_value <dbl> 0.00, 0.00, 0.00, 0.00, 0.00, 0.0...
## $ excess_return <dbl> 0, 0, 0, 0, 0, 0, 0, 0, 0, 0, 0, ...
## $ gross_leverage <dbl> 0.0000000, 0.0000000, 0.0000000, ...
## $ long_exposure <dbl> 0.00, 0.00, 0.00, 0.00, 0.00, 0.0...
## $ long_mavg <dbl> NaN, NaN, NaN, NaN, NaN, NaN, NaN...
## $ long_value <dbl> 0.00, 0.00, 0.00, 0.00, 0.00, 0.0...
## $ longs_count <dbl> 0, 0, 0, 0, 0, 0, 0, 0, 0, 0, 0, ...
## $ max_drawdown <dbl> 0.000000000, 0.000000000, 0.00000...
## $ max_leverage <dbl> 0.0000000, 0.0000000, 0.0000000, ...
## $ net_leverage <dbl> 0.0000000, 0.0000000, 0.0000000, ...
## $ orders <list> [[], [], [], [], [], [], [], [],...
## $ period_close <dttm> 2013-01-02 21:00:00, 2013-01-03 ...
## $ period_label <chr> "2013-01", "2013-01", "2013-01", ...
## $ period_open <dttm> 2013-01-02 14:31:00, 2013-01-03 ...
## $ pnl <dbl> 0.0000, 0.0000, 0.0000, 0.0000, 0...
## $ portfolio_value <dbl> 10000.000, 10000.000, 10000.000, ...
## $ positions <list> [[], [], [], [], [], [], [], [],...
## $ returns <dbl> 0.000000000, 0.000000000, 0.00000...
## $ sharpe <dbl> NaN, NaN, NaN, NaN, NaN, NaN, NaN...
## $ short_exposure <dbl> 0, 0, 0, 0, 0, 0, 0, 0, 0, 0, 0, ...
## $ short_mavg <dbl> NaN, NaN, NaN, NaN, NaN, NaN, NaN...
## $ short_value <dbl> 0, 0, 0, 0, 0, 0, 0, 0, 0, 0, 0, ...
## $ shorts_count <dbl> 0, 0, 0, 0, 0, 0, 0, 0, 0, 0, 0, ...
## $ sortino <dbl> NaN, NaN, NaN, NaN, NaN, NaN, NaN...
## $ starting_cash <dbl> 10000.0000, 10000.0000, 10000.000...
## $ starting_exposure <dbl> 0.0, 0.0, 0.0, 0.0, 0.0, 0.0, 0.0...
## $ starting_value <dbl> 0.0, 0.0, 0.0, 0.0, 0.0, 0.0, 0.0...
## $ trading_days <dbl> 1, 2, 3, 4, 5, 6, 7, 8, 9, 10, 11...
## $ transactions <list> [[], [], [], [], [], [], [], [],...
## $ treasury_period_return <dbl> 0, 0, 0, 0, 0, 0, 0, 0, 0, 0, 0, ...First, let’s plot the asset (JPM) along with the short and long moving averages. We can see there are a few crossovers.
performance_time %>%
    select(date, JPM, short_mavg, long_mavg) %>%
    gather(key = "key", value = "value", -date, factor_key = T) %>%
    ggplot(aes(date, value, color = key, linetype = key)) +
    geom_line() +
    theme_tq() +
    scale_color_manual(values = c(palette_light()[[1]], "blue", "red")) +
    scale_y_continuous(labels = scales::dollar) +
    labs(
        title = "JPM Stock Price",
        subtitle = "Strategy: 20 Day Short MA, 150 Day Long MA",
        x = "Date", y = "Share Price"
    )
Next, we can investigate the transactions. Stored within the performance_time output are transaction information as nested tibbles. We can get these values by flagging which time points contain tibbles and the filtering and unnesting. A transaction type can be determined if the “amount” of the transaction (number of shares bought or sold) is positive or negative.
transactions_flagged_time <- performance_time %>%
    select(date, portfolio_value, transactions) %>%
    mutate(flag_transactions = map_lgl(transactions, is.tibble)) %>%
    filter(flag_transactions == TRUE) %>%
    unnest() %>%
    mutate(transaction_type = ifelse(amount >= 0, "buy", "sell"))

transactions_flagged_time %>%
    glimpse()
## Observations: 9
## Variables: 10
## $ date <dttm> 2013-01-31 21:00:00, 2014-05-07 20:00:...
## $ portfolio_value <dbl> 9994.801, 11472.859, 11467.007, 11488.6...
## $ flag_transactions <lgl> TRUE, TRUE, TRUE, TRUE, TRUE, TRUE, TRU...
## $ commission <lgl> NA, NA, NA, NA, NA, NA, NA, NA, NA
## $ amount <int> 212, -212, 197, 2, -199, 179, -179, 166, 3
## $ sid <list> [<environment: 0x0000000027ce8480>, <e...
## $ order_id <chr> "573c67da9fb6481c8a10cc55cddf57eb", "79...
## $ price <dbl> 47.07353, 54.02298, 57.44871, 57.55877,...
## $ dt <dttm> 2013-01-31 21:00:00, 2014-05-07 21:00:...
## $ transaction_type <chr> "buy", "sell", "buy", "buy", "sell", "b...Finally, we can visualize the results using ggplot2. We can see that the ending portfolio value is just under $11.5K.
performance_time %>%
    ggplot(aes(x = date, y = portfolio_value)) +
    geom_line(color = palette_light()[[1]]) +
    geom_point(aes(color = transaction_type), size = 5,
               data = transactions_flagged_time) +
    geom_label_repel(
        aes(label = amount), vjust = -1, color = palette_light()[[1]],
        data = transactions_flagged_time) +
    theme_tq() +
    scale_color_tq() +
    scale_y_continuous(labels = scales::dollar) +
    labs(title = "Portfolio Value And Transactions",
         subtitle = "JPM Strategy: Short MA = 20, Long MA = 150",
         x = "Date", y = "Portfolio Value"
    )
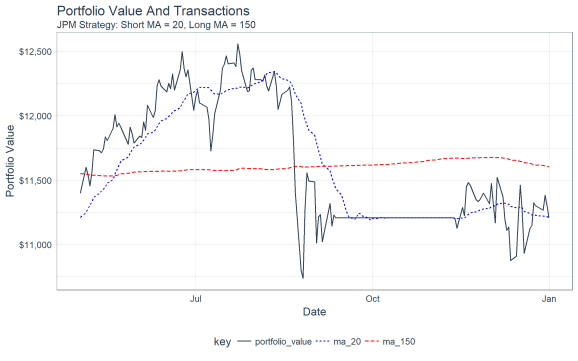
Last, let’s use tibbletime to see what happened to our portfolio towards the end. We’ll use the portfolio value as a proxy for the stock price, visualizing the crossover of the 20 and 150-day moving averages of the portfolio. Note that the actual algorithm is run with moving averages based on the adjusted stock price, not the portfolio value.
performance_time %>%
    # Data manipulation with tibbletime & multi_roller() function
    select(date, portfolio_value) %>%
    multi_roller(portfolio_value, mean, window = c(20, 150), sep = "ma_") %>%
    filter_time("2015-05-01" ~ "end") %>%
    gather(key = key, value = value, -date, factor_key = T) %>%

    # Visualization with ggplot2
    ggplot(aes(date, value, color = key, linetype = key)) +
    geom_line() +
    theme_tq() +
    scale_color_manual(values = c(palette_light()[[1]], "blue", "red")) +
    scale_y_continuous(labels = scales::dollar) +
    labs(title = "Portfolio Value And Transactions",
         subtitle = "JPM Strategy: Short MA = 20, Long MA = 150",
         x = "Date", y = "Portfolio Value"
    )
Backtest Optimization Via Grid Search
Now for the main course: Optimizing our algorithm using the backtested performance. To do so, we’ll combine what we learned from our three packages: tibbletime + furrr + flyingfox.
Let’s say we want to use backtesting to find the optimal combination or several best combinations of short and long term moving averages for our strategy. We can do this using Cartesian Grid Search, which is simply creating a combination of all of the possible “hyperparameters” (parameters we wish to adjust). Recognizing that running multiple backtests can take some time, we’ll parallelize the operation too.
Preparation
Before we can do grid search, we need to adjust our fly_handle_data() function to enable our parameters to be adjusted. The two parameters we are concerned with are the short and long moving averages. We’ll add these as arguments of a new function fly_handle_data_parameterized().
fly_handle_data_parameterized <- function(context, data,
                                          short_ma = 20L, long_ma = 150L) {

    # Increment day
    context$i <- context$i + 1L

    # While < 300 days of data, return
    if(context$i < 300) {
        return()
    }

    # Calculate a short term (20 day) moving average
    # by pulling history for the asset (JPM) and taking an average
    short_hist <- fly_data_history(data, context$asset, "price",
                                   bar_count = short_ma, frequency = "1d")
    short_mavg <- mean(short_hist)

    # Calculate a long term (150 day) moving average
    long_hist <- fly_data_history(data, context$asset, "price",
                                  bar_count = long_ma, frequency = "1d")
    long_mavg <- mean(long_hist)

    # If short > long, go 100% in JPM
    if(short_mavg > long_mavg) {
        fly_order_target_percent(asset = context$asset, target = 1)
    }
    # Else if we hit the crossover, dump all of JPM
    else if (short_mavg < long_mavg) {
        fly_order_target_percent(asset = context$asset, target = 0)
    }

    # Record today's data
    # We record the current JPM price, along with the value of the short and long
    # term moving average
    fly_record(
        JPM = fly_data_current(data, context$asset, "price"),
        short_mavg = short_mavg,
        long_mavg  = long_mavg
    )

}
Making The Grid
Next, we can create a grid of values from a list() containing the hyperparameter values. We can turn this into a cross product as a tibble using the cross_df() function.
ma_grid_tbl <- list(
    short_ma = seq(20, 100, by = 20),
    long_ma  = seq(150, 300, by = 50)
) %>%
    cross_df()

ma_grid_tbl
## # A tibble: 20 x 2
## short_ma long_ma
## <dbl> <dbl>
## 1 20 150
## 2 40 150
## 3 60 150
## 4 80 150
## 5 100 150
## 6 20 200
## 7 40 200
## 8 60 200
## 9 80 200
## 10 100 200
## 11 20 250
## 12 40 250
## 13 60 250
## 14 80 250
## 15 100 250
## 16 20 300
## 17 40 300
## 18 60 300
## 19 80 300
## 20 100 300Now that we have the hyperparameters, let’s create a new column with the function we wish to run. We’ll use the partial() function to partially fill the function with the hyper parameters.
ma_grid_tbl <- ma_grid_tbl %>%
    mutate(f = map2(.x = short_ma,
                    .y = long_ma,
                    .f = ~ partial(fly_handle_data_parameterized,
                                   short_ma = .x, long_ma = .y)))

ma_grid_tbl
## # A tibble: 20 x 3
## short_ma long_ma f
## <dbl> <dbl> <list>
## 1 20 150 <fn>
## 2 40 150 <fn>
## 3 60 150 <fn>
## 4 80 150 <fn>
## 5 100 150 <fn>
## 6 20 200 <fn>
## 7 40 200 <fn>
## 8 60 200 <fn>
## 9 80 200 <fn>
## 10 100 200 <fn>
## 11 20 250 <fn>
## 12 40 250 <fn>
## 13 60 250 <fn>
## 14 80 250 <fn>
## 15 100 250 <fn>
## 16 20 300 <fn>
## 17 40 300 <fn>
## 18 60 300 <fn>
## 19 80 300 <fn>
## 20 100 300 <fn>Running Grid Search In Parallel Using furrr
Now for the Grid Search. We use the future_map() function to process in parallel. Make sure to setup a plan() first. The following function runs the fly_run_algorithm() for each fly_handle_data() function stored in the “f” column.
plan("multiprocess")

results_tbl <- ma_grid_tbl %>%
    mutate(results = future_map(
        .x = f,
        .f = ~ fly_run_algorithm(
            initialize  = fly_initialize,
            handle_data = .x,
            start       = as.Date("2013-01-01"),
            end         = as.Date("2016-01-01")
            )
    ))

results_tbl
## # A tibble: 20 x 4
## short_ma long_ma f results
## <dbl> <dbl> <list> <list>
## 1 20 150 <fn> <tibble [756 x 41]>
## 2 40 150 <fn> <tibble [756 x 41]>
## 3 60 150 <fn> <tibble [756 x 41]>
## 4 80 150 <fn> <tibble [756 x 41]>
## 5 100 150 <fn> <tibble [756 x 41]>
## 6 20 200 <fn> <tibble [756 x 41]>
## 7 40 200 <fn> <tibble [756 x 41]>
## 8 60 200 <fn> <tibble [756 x 41]>
## 9 80 200 <fn> <tibble [756 x 41]>
## 10 100 200 <fn> <tibble [756 x 41]>
## 11 20 250 <fn> <tibble [756 x 41]>
## 12 40 250 <fn> <tibble [756 x 41]>
## 13 60 250 <fn> <tibble [756 x 41]>
## 14 80 250 <fn> <tibble [756 x 41]>
## 15 100 250 <fn> <tibble [756 x 41]>
## 16 20 300 <fn> <tibble [756 x 41]>
## 17 40 300 <fn> <tibble [756 x 41]>
## 18 60 300 <fn> <tibble [756 x 41]>
## 19 80 300 <fn> <tibble [756 x 41]>
## 20 100 300 <fn> <tibble [756 x 41]>Inspecting The Backtest Performance Results
The performance results are stored in the “results” column as tbl_time objects. We can examine the first result.
results_tbl$results[[1]]## # A time tibble: 756 x 41
## # Index: date
## date JPM algo_volatility algorithm_period_~ alpha
## <dttm> <dbl> <dbl> <dbl> <dbl>
## 1 2013-01-02 21:00:00 NaN NaN 0 NaN
## 2 2013-01-03 21:00:00 NaN 0 0 NaN
## 3 2013-01-04 21:00:00 NaN 0 0 NaN
## 4 2013-01-07 21:00:00 NaN 0 0 NaN
## 5 2013-01-08 21:00:00 NaN 0 0 NaN
## 6 2013-01-09 21:00:00 NaN 0 0 NaN
## 7 2013-01-10 21:00:00 NaN 0 0 NaN
## 8 2013-01-11 21:00:00 NaN 0 0 NaN
## 9 2013-01-14 21:00:00 NaN 0 0 NaN
## 10 2013-01-15 21:00:00 NaN 0 0 NaN
## # ... with 746 more rows, and 36 more variables:
## # benchmark_period_return <dbl>, benchmark_volatility <dbl>,
## # beta <dbl>, capital_used <dbl>, ending_cash <dbl>,
## # ending_exposure <dbl>, ending_value <dbl>, excess_return <dbl>,
## # gross_leverage <dbl>, long_exposure <dbl>, long_mavg <dbl>,
## # long_value <dbl>, longs_count <dbl>, max_drawdown <dbl>,
## # max_leverage <dbl>, net_leverage <dbl>, orders <list>,
## # period_close <dttm>, period_label <chr>, period_open <dttm>,
## # pnl <dbl>, portfolio_value <dbl>, positions <list>,
## # returns <dbl>, sharpe <dbl>, short_exposure <dbl>,
## # short_mavg <dbl>, short_value <dbl>, shorts_count <dbl>,
## # sortino <dbl>, starting_cash <dbl>, starting_exposure <dbl>,
## # starting_value <dbl>, trading_days <dbl>, transactions <list>,
## # treasury_period_return <dbl>We can also get the final portfolio value using a combination of pull() and tail().
results_tbl$results[[1]] %>%
    pull(portfolio_value) %>%
    tail(1)
## [1] 9187.849We can turn this into a function and map it to all of the columns to obtain the “final_portfolio_value” for each of the grid search combinations.
results_tbl <- results_tbl %>%
    mutate(final_portfolio_value = map_dbl(results,
                                           ~ pull(.x, portfolio_value) %>%
                                               tail(1)))

results_tbl
## # A tibble: 20 x 5
## short_ma long_ma f results final_portfolio_value
## <dbl> <dbl> <list> <list> <dbl>
## 1 20 150 <fn> <tibble [756 x 41]> 9188.
## 2 40 150 <fn> <tibble [756 x 41]> 9277.
## 3 60 150 <fn> <tibble [756 x 41]> 9823.
## 4 80 150 <fn> <tibble [756 x 41]> 10816.
## 5 100 150 <fn> <tibble [756 x 41]> 10697.
## 6 20 200 <fn> <tibble [756 x 41]> 9065.
## 7 40 200 <fn> <tibble [756 x 41]> 10612.
## 8 60 200 <fn> <tibble [756 x 41]> 11444.
## 9 80 200 <fn> <tibble [756 x 41]> 11366.
## 10 100 200 <fn> <tibble [756 x 41]> 11473.
## 11 20 250 <fn> <tibble [756 x 41]> 9522.
## 12 40 250 <fn> <tibble [756 x 41]> 10898.
## 13 60 250 <fn> <tibble [756 x 41]> 11494.
## 14 80 250 <fn> <tibble [756 x 41]> 11494.
## 15 100 250 <fn> <tibble [756 x 41]> 11494.
## 16 20 300 <fn> <tibble [756 x 41]> 10951.
## 17 40 300 <fn> <tibble [756 x 41]> 11494.
## 18 60 300 <fn> <tibble [756 x 41]> 11494.
## 19 80 300 <fn> <tibble [756 x 41]> 11494.
## 20 100 300 <fn> <tibble [756 x 41]> 11494.Visualizing The Backtest Performance Results
Now let’s visualize the results to see which combinations of short and long moving averages maximize the portfolio value. It’s clear that short >= 60 days and long >= 200 days maximize the return. But, why?
results_tbl %>%
    ggplot(aes(long_ma, short_ma, color = final_portfolio_value)) +
    geom_point(aes(size = final_portfolio_value)) +
    geom_label_repel(
        aes(label = scales::dollar(round(final_portfolio_value, 0))),
        vjust = -1, color = palette_light()[[1]]) +
    theme_tq() +
    scale_color_gradient(low = palette_light()[[1]], high = palette_light()[[3]]) +
    scale_size(range = c(1, 12)) +
    labs(
        title = "JPM Strategy: Backtest Grid Search Optimization",
        subtitle = "Short and Fast Moving Averages: Optimum = 60 days (Short MA), 300 Days (Long MA)",
        x = "Long Moving Average (Days)", y = "Short Moving Average (Days)",
        color = "Final Portfolio Value", size = "Final Portfolio Value"
    ) +
    theme(legend.direction = "vertical",
          legend.position = "right")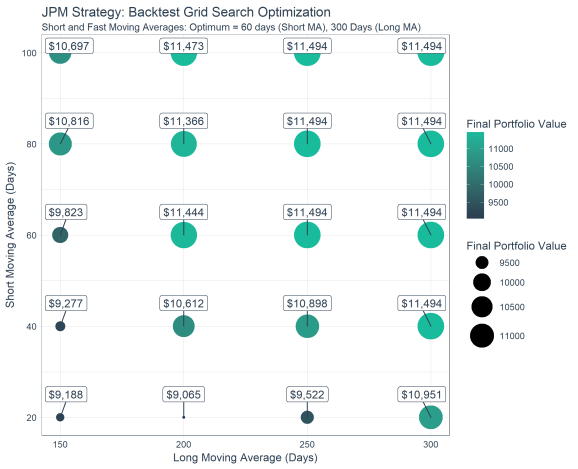
Let’s get the transaction information (buy/sell) by unnesting the results and determining which transactions are buys and sells.
transactions_tbl <- results_tbl %>%
    unnest(results) %>%
    select(short_ma:date, portfolio_value, transactions) %>%
    mutate(flag_transactions = map_lgl(transactions, is.tibble)) %>%
    filter(flag_transactions == TRUE) %>%
    unnest() %>%
    mutate(transaction_type = ifelse(amount >= 0, "buy", "sell")) %>%
    mutate(
        short_ma = as.factor(short_ma) %>% fct_rev(),
        long_ma  = as.factor(long_ma)
    )

transactions_tbl  %>%
    glimpse()
## Observations: 105
## Variables: 13
## $ short_ma <fct> 20, 20, 20, 20, 20, 20, 20, 20, 20,...
## $ long_ma <fct> 150, 150, 150, 150, 150, 150, 150, ...
## $ final_portfolio_value <dbl> 9187.849, 9187.849, 9187.849, 9187....
## $ date <dttm> 2014-03-13 20:00:00, 2014-03-14 20...
## $ portfolio_value <dbl> 9994.890, 9888.191, 9404.815, 9400....
## $ flag_transactions <lgl> TRUE, TRUE, TRUE, TRUE, TRUE, TRUE,...
## $ commission <lgl> NA, NA, NA, NA, NA, NA, NA, NA, NA,...
## $ amount <int> 172, 2, -174, 161, 2, -163, 147, -1...
## $ sid <list> [<environment: 0x0000000029504e20>...
## $ order_id <chr> "d8a3551cb36c4ff985c42e4d78e00ef8",...
## $ price <dbl> 57.44871, 56.82840, 54.02298, 57.44...
## $ dt <dttm> 2014-03-13 21:00:00, 2014-03-14 21...
## $ transaction_type <chr> "buy", "buy", "sell", "buy", "buy",...Finally, we can visualize the portfolio value over time for each combination of short and long moving averages. By plotting the buy/sell transactions, we can see the effect on a stock with a bullish trend. The portfolios with the optimal performance are those that were bought and held rather than sold using the moving average crossover. For this particular stock, the benefit of downside protection via the moving average crossover costs the portfolio during the bullish uptrend.
results_tbl %>%
    unnest(results) %>%
    mutate(
        short_ma = as.factor(short_ma) %>% fct_rev(),
        long_ma  = as.factor(long_ma)
    ) %>%
    group_by(short_ma, long_ma) %>%
    filter_time("2014" ~ "end") %>%
    ggplot(aes(date, portfolio_value)) +
    geom_line(color = palette_light()[[1]]) +
    geom_vline(aes(xintercept = date), color = "blue",
               data = filter(transactions_tbl, transaction_type == "buy")) +
    geom_vline(aes(xintercept = date), color = "red",
               data = filter(transactions_tbl, transaction_type == "sell")) +
    facet_grid(short_ma ~ long_ma, labeller = label_both) +
    theme_tq() +
    scale_y_continuous(labels = scales::dollar) +
    scale_x_datetime(date_labels = "%Y", date_breaks = "1 year") +
    labs(
        title = "JPM Strategy: Portfolio Value Over Time With Transactions",
        subtitle = "Bull Market: Buy and Hold Strategy is Optimal Vs Short/Long Moving Average Strategies",
        x = "Date", y = "Portfolio Value"
    )
Conclusions
We’ve covered a lot of ground in this article. Congrats if you’ve made it through. You’ve now been exposed to three cool packages:
tibbletime: For time-series in the tidyversefurrr: Our parallel processing extension topurrrflyingfox: Our experimental package brought to you as part of our Business Science Labs initiative
Further, you’ve seen how to apply all three of these packages to perform grid search backtest optimization of your trading algorithm.
Business Science University
If you are looking to take the next step and learn Data Science For Business (DS4B), you should consider Business Science University. Our goal is to empower data scientists through teaching the tools and techniques we implement every day. You’ll learn:
- Data Science Framework: Business Science Problem Framework
- Tidy Eval
- H2O Automated Machine Learning
- LIME Feature Explanations
- Sensitivity Analysis
- Tying data science to financial improvement
All while solving a REAL WORLD CHURN PROBLEM: Employee Turnover!
DS4B Virtual Workshop: Predicting Employee Attrition
Did you know that an organization that loses 200 high performing employees per year is essentially losing $15M/year in lost productivity? Many organizations don’t realize this because it’s an indirect cost. It goes unnoticed. What if you could use data science to predict and explain turnover in a way that managers could make better decisions and executives would see results? You will learn the tools to do so in our Virtual Workshop. Here’s an example of a Shiny app you will create.

Shiny App That Predicts Attrition and Recommends Management Strategies, Taught in HR 301
Our first Data Science For Business Virtual Workshop teaches you how to solve this employee attrition problem in four courses that are fully integrated:
- HR 201: Predicting Employee Attrition with
h2oandlime - HR 301 (Coming Soon): Building A
ShinyWeb Application - HR 302 (EST Q4): Data Story Telling With
RMarkdownReports and Presentations - HR 303 (EST Q4): Building An R Package For Your Organization,
tidyattrition
The Virtual Workshop is intended for intermediate and advanced R users. It’s code intensive (like these articles), but also teaches you fundamentals of data science consulting including CRISP-DM and the Business Science Problem Framework. The content bridges the gap between data science and the business, making you even more effective and improving your organization in the process.
Don’t Miss A Beat
- Sign up for the Business Science blog to stay updated
- Enroll in Business Science University to learn how to solve real-world data science problems from Business Science
- Check out our Open Source Software
Connect With Business Science
If you like our software (anomalize, tidyquant, tibbletime, timetk, and sweep), our courses, and our company, you can connect with us:
- business-science on GitHub
- Business Science, LLC on LinkedIn
- bizScienc on twitter
- Business Science, LLC on Facebook
R-bloggers.com offers daily e-mail updates about R news and tutorials about learning R and many other topics. Click here if you're looking to post or find an R/data-science job.
Want to share your content on R-bloggers? click here if you have a blog, or here if you don't.