
"NIR Std. Dev. Spectra" with "R"
[This article was first published on NIR-Quimiometría, and kindly contributed to R-bloggers]. (You can report issue about the content on this page here)
Want to share your content on R-bloggers? click here if you have a blog, or here if you don't.
Want to share your content on R-bloggers? click here if you have a blog, or here if you don't.
It is always good to look at the spectra from different points of view, before to develop a regression, this will help us to understand better our samples, to detect outliers, to check where the variability is, if that variability correlates with the constituent of interest (directly or inverse),…..
Chemometric software’s have the tools to do it.
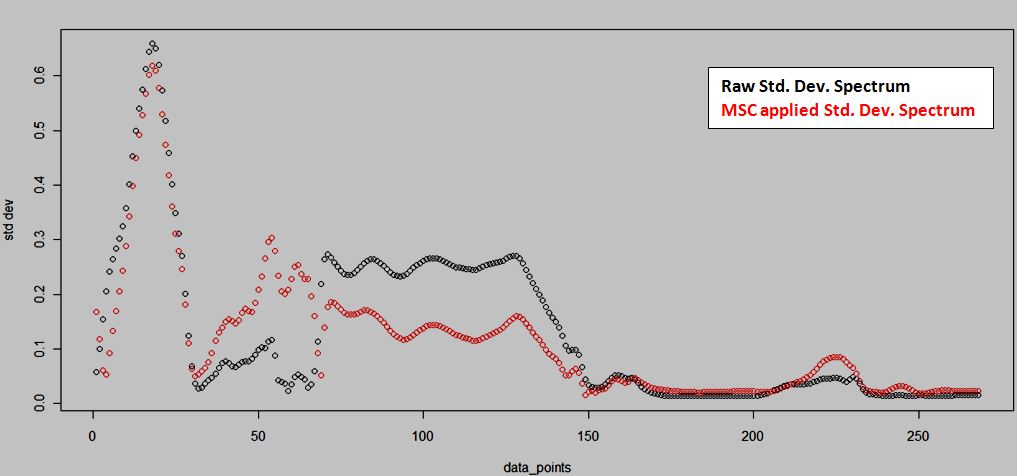
A single tool to check our spectra is the standard deviation spectrum where every data point has the standard deviation value for the absorbances at every wavelength,. This SD spectrum is a nice way to see where the variability is, so we can understand better the importance of the wavelengths in other calculations as the principal components, loadings,….
In the previous post we have seen how to apply MSC (Multiple Scatter Correction) to the NIR Spectra (Yarn) with “R”.
To understand better the effect of this math treatment, we can have a look to the standard deviation spectra.
For this post, the idea is a simple exercise to over plot the “standard deviation spectra” of the Yarn NIR Data (from the PLS package) “with and without” the MSC (Multiple Scatter Correction) applied.
> sd_spec<-sd(yarn$NIR)
> yarn_msc<-msc(yarn$NIR)
> sd_mscspec<-sd(yarn_msc)
> sd_overplot<-cbind(sd_spec,sd_mscspec)
> wavelength<-c(1:268)
> matplot(wavelength,sd_overplot,lty=1,pch=21,
+ xlab=”data_points”,ylab=”std dev”)
To leave a comment for the author, please follow the link and comment on their blog: NIR-Quimiometría.
R-bloggers.com offers daily e-mail updates about R news and tutorials about learning R and many other topics. Click here if you're looking to post or find an R/data-science job.
Want to share your content on R-bloggers? click here if you have a blog, or here if you don't.