
Motivating Students
[This article was first published on Adventures in Analytics and Visualization, and kindly contributed to R-bloggers]. (You can report issue about the content on this page here)
Want to share your content on R-bloggers? click here if you have a blog, or here if you don't.
Want to share your content on R-bloggers? click here if you have a blog, or here if you don't.
Figure shown to students in a particular class to show the effect of slacking after the mid-semester grades are received.
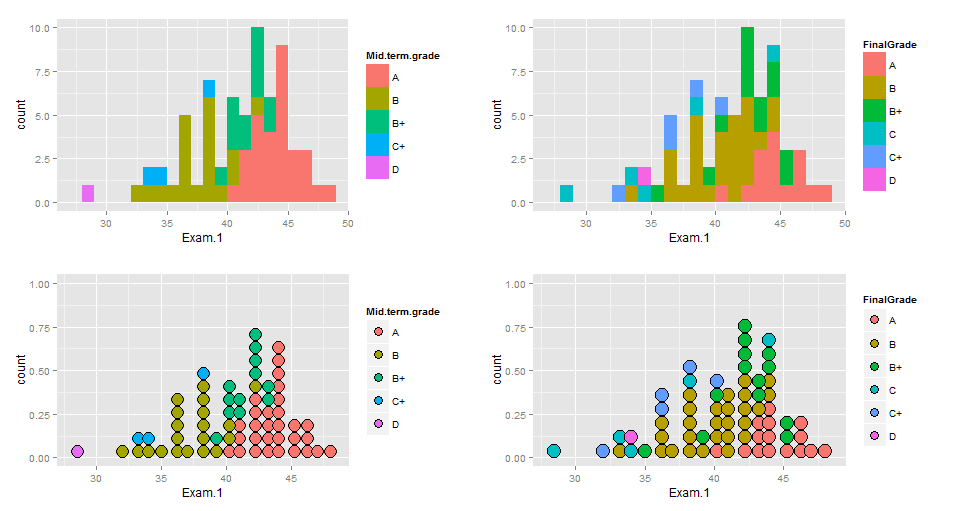
Background information: A course has multiple components – Exams, projects, quizzes, assignments, etc. The objective of this set of plots was two fold – (a) To show students that their mid-term grade is not the same as the grade on the exam and that it included several other components, and (b) To show students that their mid-term grades could change based on how well/poorly they performed during the rest of the semester. The left column of plots show a histogram (upper) and a dot plot (bottom) of student scores on Exam 1 of the course. The color denotes the grade they received at mid-term. The color in the right column of plots shows the final grades of the same students. Student positions in all four plots were fixed based on their Exam 1 score. One marked change in transition of colors from the left column to the right shows the brown “B” bleeding into the red/pink “A”, suggesting that many students who received an A in the mid-term grade ended up receiving a B at the end of the semester due to their lackluster performance subsequently. The third objective of this figure, in hindsight, is to show how ggplot automatically picks the sequence of levels for its legend. Yes, B+ should appear above B in the legend and other corrections of that sort need to be made manually. To that extent, ggplot isn’t the panacea for all problems.
To leave a comment for the author, please follow the link and comment on their blog: Adventures in Analytics and Visualization.
R-bloggers.com offers daily e-mail updates about R news and tutorials about learning R and many other topics. Click here if you're looking to post or find an R/data-science job.
Want to share your content on R-bloggers? click here if you have a blog, or here if you don't.