
Hadoop for R’s Data scientist
[This article was first published on Learning Data Science , and kindly contributed to R-bloggers]. (You can report issue about the content on this page here)
Want to share your content on R-bloggers? click here if you have a blog, or here if you don't.
I don’t exactly know where to start. But, after a real pleasant discussion with one of my ex colleague, it seems that there are many thongs around Hadoop ecosystem and R for analyst that should be said by a data scientist, means that, someone who don’t know much more about big data architecture, but who should know the essentials about the simple architecture that can allow to run better analysis in the best conditions.Want to share your content on R-bloggers? click here if you have a blog, or here if you don't.
For sure, good knowledge about how R can use hadoop platform to run better analysis is very important.
A small plan :
– Hadoop ecosystem
– R and Hadoop
– Launch big data job on R using Hadoop
Hadoop ecosystem
We use Hadoop when :
– you need agility
– you need to perform analysis with diversity of data sources
– your architecture require to move on tim
– you need to reduce your costsI
Hadoop is :
An ecosystem
Designed for storage and analytical computation
Design for running analysis in parallel
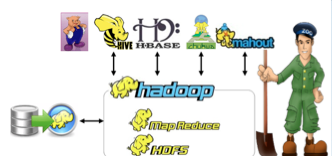
When we talk about Hadoop, we deal with
HDFS (Hadoop Distributed File System : The core of solution)
Map Reduce :
Use data from HDFS and execute algorithm based on mar-reduce paradigm
High Level languages: Pig, Hive : Query language with embedded the map reduce paradigm to solve complex problems
HBase : the couch on the top of HDFS storage to build and manipulate data when random access memory is needed.
Pig or Hive : I don’t know. As you feel
You can get your own opinion reading this http://stackoverflow.com/questions/3356259/difference-between-pig-and-hive-why-have-both, but, it’s important to remind that as data scientist, it is always better to get structured data. When we have to do this, we should think about the best languages wich can suit for this quickly. Both languages run for sure map reduce paradigm and every operation is reduce to map and reduce.
Another thing to remind is:
– Hive: HQL is like SQL
– Pig: Pig Latin is a bit like Perl
In my next post, I will focus on Hive and Pig. For now, I just want to point that, Hive & Pig are components of Hadoop and Data scientist should know how to deal about
There’s a good post on Internet which explain how to install Hadoop and how to make it connected with R. In my opinion, the best is : Tutorial R and Hadoop except the part wich explain that we need homebrew to set Hadoop environment
Interact with Hadoop

In the terminal, we can build basic operations. For example, pick up data from cluster and load it into memory for analysis with R;
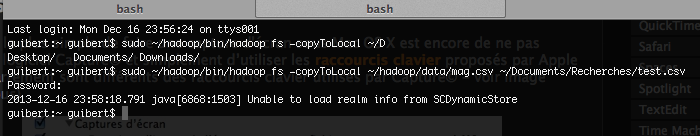
We can then load this data with R command
We can also do this in R terminal without dealing with the Mac’s terminal
> system(“~/hadoop/bin/hadoop fs -copyToLocal ~/hadoop/data/mag.csv ~/Documents/Recherches/test2.csv”)
The main hadoop command can be find out there : http://hadoop.apache.org/docs/r0.18.3/hdfs_shell.html
A small map reduce job
Map reduce is a programming pattern witch aid in the parallel analysis of data.
The name is because of two parts of the algorithm :
map = to identify the subject of the data by key
reduce = group by key identified and run analysis
There is many packages to run map reduce job in R :
* HadoopStreaming
* Hive
* Rhipe
* RHadoop (with rmr2,Hbase, Rhdfs) are maintain by Revolution Analytics and provide some of good functions to interact with hadoop environment
etc… For sure, I overlook many others good packages.
Let us introduce how to run a simple map reduce job using RHadoop
suppose that we have this data :
> x=sample(rep(c(“F”,”V”,”R”),10000),size=1000000,replace=T)
> df=data.frame(value=x, note=abs(9*rnorm(1000000)))
> head(df)
value note
1 F 4.209874
2 V 9.587087
3 F 6.323354
4 V 9.274668
5 R 13.886767
6 V 5.273159
> dim(df)
[1] 1000000 2
And we want to determine witch value has “note” greater than the mean of all value
If we have to do this using R, we should run this :
> meanAll = mean(df$note)
> meanAll
[1] 7.18068
> meanGroup<-aggregate(x=df$note,by=list(df$value),FUN=mean)
> meanGroup
Group.1 x
1 F 7.170956
2 R 7.189213
3 V 7.181848
> index =meanGroup$x>=meanAll
> index
[1] FALSE TRUE TRUE
> meanGroup$Group.1[index]
[1] R V
If we want to do this with map reduce, we will do something like this
demo = to.dfs(demo)
monMap = function(k,v)
{
w <- v[2]
keyval(w,v[1])
}
monReduce<-function(k,val)
{
keyval(k, mean(val))
}
job<-mapreduce(input=demo, map =monMap,reduce = monReduce)
from.dfs(job)
Some helpful litterature around Map Reduce
http://www.asterdata.com/wp_mapreduce_and_the_data_scientist/
https://class.coursera.org/datasci-001/lecture/71
http://www.information-management.com/ad_includes/welcome_imt.html
In my next post, I will talk about Pig and Hive for preparing dataset beforme machine learning,
To leave a comment for the author, please follow the link and comment on their blog: Learning Data Science .
R-bloggers.com offers daily e-mail updates about R news and tutorials about learning R and many other topics. Click here if you're looking to post or find an R/data-science job.
Want to share your content on R-bloggers? click here if you have a blog, or here if you don't.