
Florence Nightingale and the importance of Data Visualization
Want to share your content on R-bloggers? click here if you have a blog, or here if you don't.
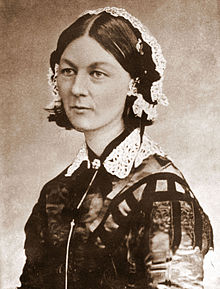
Florence Nightingale is held as a heroine for the British people because of her work during the Crimean War. However, she would not have been so fairly recognised if she had not been also a superb statistician: in a brilliant documentary released by the BBC in December 2010 as part of the series “The beauty of Diagrams” , the dilemma Nightingale had to face after returning from the Crimean War is depicted; after retrieving information about the soldier´s death causes in the military hospital during two years, she discovered some revealing facts: the majority of them were dying not because of wounds caused during the battle but due to infections (typhus and colera, among others) inside the hospital, triggered by neglecting hygiene conditions.
In this regard, she was convinced that similar changes to those made during the Crimean War in the military hospitals would have the same results in the civilian hospitals in London. When she came back, she faced many difficulties in getting an appointment with the responsibles for the sanity in hospitals to show her proposal. After a long struggle, she finally managed to receive an audition, but of a very short duration. In this context, she knew her presentation had to be short and concise, but very impactful at the same time.
Challenged by this adversity, she came up to the idea of what we know today as the Nightingale Diagram or Nightingale Rose, a circular graph that shows the amount of deaths per cause throughout the months. As we can see, the picture is self-explanatory of the issue Nightingale wanted to point out. The clarity of this diagram enabled her to convince the Authorities in London of the necessity of a change in the sanitary conditions, as the diagram left no space for misinterpretation.

Nightingale Diagram: Blue represents deaths occasioned by diseases, red stands for the deaths due to wounds and black for all other causes of death.
This anecdote does not differ very much from what we, actual data workers, have to cope with every day; bosses or managers, who we have to convince in a very short time. Therefore, our presentation has to summarize as much as possible many hours invested in that task and, at the same time, prove our points. Here is where Data Visualization becomes a great ally: the ability to show results in a convincing way is as important as the long hours of work that took us to arrive to that conclusions.
In our digital era, there are plenty of programmes that can help us with this and, what´s more, many of them are completely free and open source. My personal favourite (and the one I will use most in this blog) is R.
To conclude this first post, below you will find an R Script to recreate your own Rose Diagram (as similar as possible. I was not able to adapt the second pie to the scale of the first one)
Any comments, questions, recommendations, please shoot ![]() !
!
#you will need to have the library plotrix installed
library (plotrix)
#I could not manage to upload the dataset. Whenever I am able to download it I will do it
data <- as.matrix(read.table(“wherever you get the dataset”,header=TRUE))
#Dirty color-binding
data <- cbind (data,’red’)
data <- cbind (data, ‘blue’)
data <- cbind (data, ‘green’)
colnames(data)[5] <- ‘color1′
colnames(data)[6] <- ‘color2′
colnames(data)[7] <- ‘color3′
#The series have to be added up, so that the diagram superposition respects the area of each case
series1 <- as.numeric(data[1:12,4]) + as.numeric(data[1:12,3]) + as.numeric(data[1:12,2])
series2 <- as.numeric(data[1:12,3]) + as.numeric(data[1:12,2])
series3 <- as.numeric(data[1:12,2])
series4 <- as.numeric(data[13:24,4]) + as.numeric(data[13:24,3]) + as.numeric(data[13:24,2])
series5 <- as.numeric(data[13:24,3]) + as.numeric(data[13:24,2])
series6 <- as.numeric(data[13:24,2])
#Drawing the plot for year 1. Setting rings in different colors is a bit tricky and that´s it is easier by creating three graphs
radial.pie (series1, labels= data[1:12,1], sector.colors = data [1:12,5], clockwise= TRUE, show.grid.labels= FALSE, add = FALSE)
radial.pie (series2,sector.colors = data[1:12,6], labels= data[1:12,1], clockwise= TRUE, add = TRUE, show.grid.labels= FALSE)
radial.pie (series3,sector.colors = data[1:12,7], labels= data[1:12,1], clockwise= TRUE, add = TRUE, show.grid.labels= FALSE)
# legend for the graph
legend (x=3000,y=8,legend = c(colnames(data)[4],colnames(data)[3],colnames(data)[2]), border = data [1,5:7], fill=data [1,5:7])
#Year 2
radial.pie (series4, labels= data[13:24,1], sector.colors = data [1:12,5], clockwise= TRUE, show.grid.labels= FALSE, add = FALSE, radial.lim = max(series1))
radial.pie (series5,sector.colors = data[1:12,6], labels= data[1:12,1], clockwise= TRUE, add = TRUE, show.grid.labels= FALSE)
radial.pie (series6,sector.colors = data[1:12,7], labels= data[1:12,1], clockwise= TRUE, add = TRUE, show.grid.labels= FALSE)
legend (x=1600,y=8,legend = c(colnames(data)[4],colnames(data)[3],colnames(data)[2]), border = data [1,5:7], fill=data [1,5:7])
Plot for year 1

Plot for year 2


R-bloggers.com offers daily e-mail updates about R news and tutorials about learning R and many other topics. Click here if you're looking to post or find an R/data-science job.
Want to share your content on R-bloggers? click here if you have a blog, or here if you don't.