
Coding a dynamic systems and controlling it via a graphical user interface
[This article was first published on gRaphics!, and kindly contributed to R-bloggers]. (You can report issue about the content on this page here)
Want to share your content on R-bloggers? click here if you have a blog, or here if you don't.
My work, in the past year, has consisted mostly of coding dynamic models in R, models which I will soon be exporting to a server-based R implementation, possibly thanks to rApache.Want to share your content on R-bloggers? click here if you have a blog, or here if you don't.
I ususally run my models through an input file where I specify all parameters needed, but for the end users, we felt it may be better to provide a graphical user interface where they could select just a few parameters, with the others defaulting to meaningful values.
Wioth this post I want to quickly illustrate all that’s needed to put such a system together, exception made for the rApache part. I’ve not made any steps in that direction, yet.
So, let’s start by defining a dynamic model, which we’ll integrate using the deSolve package. We use the Lorentz system, which is far simpler than any of the models I actually work with, and produces much more beautiful and interesting graphics, too.
OK, if you run this you’ll obtain a variable called ‘out’, which contains the X/Y/Z coordinates of your system at different time instants in the phase space. You can look at the values directly, but obviously plotting is a good option. Taking advantage of the ‘multiplot’ function defined in the Cookbook for R, we can write:
Which will generate the following picture:

I did make use of the alpha channel to give some sense of depth to all pictures. I would love to plot a 3D version of the Lorenz Attractor in the fourth panel, lower right – however, I didn’t want to get bogged down in defining a rotation / projection matrix.
Until now, there’s no GUI – all this happens within the command line, or if you prefer a simple R script.
Unless, that is, you also define a gWidget which can actualy control your model, like this:
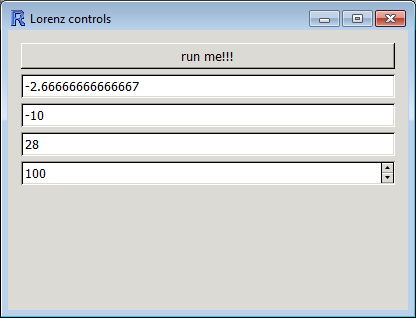
To draw this, you just need to type a few lines of code in your R script, plus some more functions to handle events (that is, you clicking the button or changing parameter values)
As a matter of fact, we can also embed the graphical output within the GUI window, either on the side of the controls, or in another tab. perhaps I’ll update the post later on to reflect that.
To leave a comment for the author, please follow the link and comment on their blog: gRaphics!.
R-bloggers.com offers daily e-mail updates about R news and tutorials about learning R and many other topics. Click here if you're looking to post or find an R/data-science job.
Want to share your content on R-bloggers? click here if you have a blog, or here if you don't.