When Documents Become Databases – Tabulizer R Wrapper for Tabula PDF Table Extractor
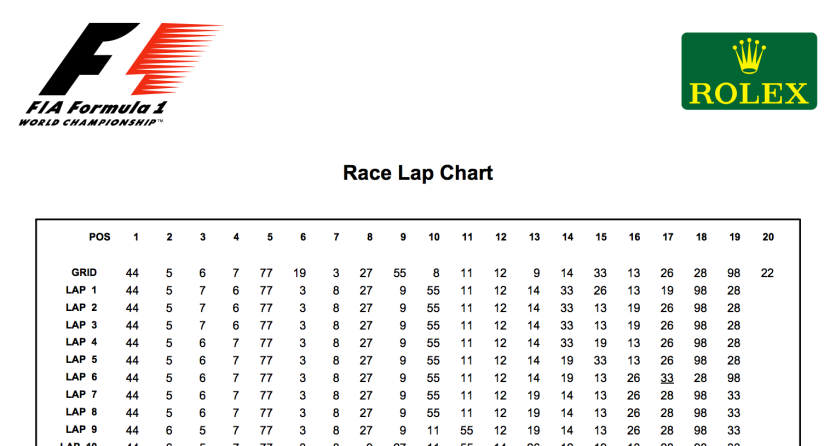
Although not necessarily the best way of publishing data, data tables in PDF documents can often be extracted quite easily, particularly if the tables are regular and the cell contents reasonably space. For example, official timing sheets for F1 races are published by the FIA as event and timing information ...