Articles by mrtnj

What single step does with relationship

May 28, 2019 | mrtnj

We had a journal club about the single step GBLUP method for genomic evaluation a few weeks ago. In this post, we’ll make a few graphs of how the single step method models relatedness between individuals. Imagine you want to use genomic selection in a breeding program that already ...
[Read more...]

Using R: plotting the genome on a line

March 31, 2019 | mrtnj

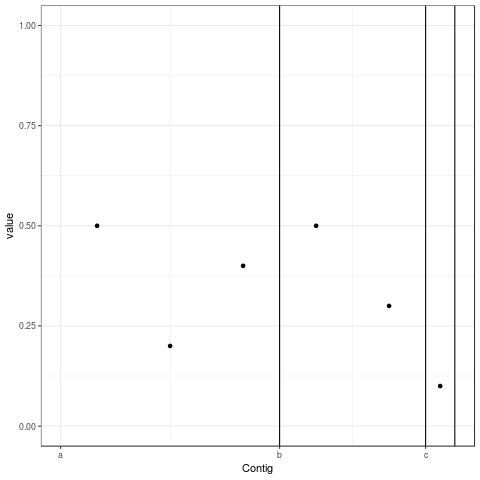
Imagine you want to make a Manhattan-style plot or anything else where you want a series of intervals laid out on one axis after one another. If it’s actually a Manhattan plot you may have a friendly R package that does it for you, but here is how to ...
[Read more...]

Showing a difference in means between two groups

January 13, 2019 | mrtnj

Visualising a difference in mean between two groups isn’t as straightforward as it should. After all, it’s probably the most common quantitative analysis in science. There are two obvious options: we can either plot the data from the two groups separately, or we can show the estimate of ...
[Read more...]

Using R: the best thing I’ve changed about my code in years

December 1, 2018 | mrtnj

Hopefully, one’s coding habits are constantly improving. If you feel any doubt about yourself, I suggest looking back at something you wrote 2011. One thing I’ve changed recently that made my life so much better is a simple silly thing: meaningful name for index and counter variables. Take a ... [Read more...]

Using R: reshape2 to tidyr

December 17, 2017 | mrtnj

Tidy data — it’s one of those terms that tend to confuse people, and certainly confused me. It’s Codd’s third normal form, but you can’t go around telling that to people and expect to be understood. One form is ”long”, the other is ”wide”. One form is ”... [Read more...]

Scripting for data analysis (with R)

July 30, 2017 | mrtnj

Course materials (GitHub) This was a PhD course given in the spring of 2017 at Linköping University. The course was organised by the graduate school Forum scientium and was aimed at people who might be interested in using R for data analysis. The materials developed from a part of a ... [Read more...]

Using R: When using do in dplyr, don’t forget the dot

May 21, 2017 | mrtnj

There will be a few posts about switching from plyr/reshape2 for data wrangling to the more contemporary dplyr/tidyr. My most common use of plyr looked something like this: we take a data frame, split it by some column(s), and use an anonymous function to do something useful. ... [Read more...]

Mutation, selection, and drift (with Shiny)

May 14, 2017 | mrtnj

Imagine a gene that comes in two variants, where one of them is deleterious to the carrier. This is not so hard to imagine, and it is often the case. Most mutations don’t matter at all. Of those that matter, most are damaging. Next, imagine that the mutation happens ...
[Read more...]

Using R: a function that adds multiple ggplot2 layers

April 23, 2017 | mrtnj

Another interesting thing that an R course participant identified: Sometimes one wants to make a function that returns multiple layers to be added to a ggplot2 plot. One could think that just adding them and returning would work, but it doesn’t. I think it has to do with how + ...
[Read more...]

Using R: Don’t save your workspace

April 2, 2017 | mrtnj

To everyone learning R: Don’t save your workspace. When you exit an R session, you’re faced with the question of whether or not to save your workspace. You should almost never answer yes. Saving your workspace creates an image of your current variables and functions, and saves them ... [Read more...]

It seems dplyr is overtaking correlation heatmaps

March 8, 2017 | mrtnj

(… on my blog, that is.) For a long time, my correlation heatmap with ggplot2 was the most viewed post on this blog. It still leads the overall top list, but by far the most searched and visited post nowadays is this one about dplyr (followed by it’s sibling about ... [Read more...]

Using R: tibbles and the t.test function

February 12, 2017 | mrtnj

A participant in the R course I’m teaching showed me a case where a tbl_df (the new flavour of data frame provided by the tibble package; standard in new RStudio versions) interacts badly with the t.test function. I had not seen this happen before. The reason is ... [Read more...]

Balancing a centrifuge

June 11, 2016 | mrtnj

I saw this cute little paper on arxiv about balancing a centrifuge: Peil & Hauryliuk (2010) A new spin on spinning your samples: balancing rotors in a non-trivial manner. Let us have a look at the maths of balancing a centrifuge. The way I think most people (including myself) balance their samples ...
[Read more...]

Toying with models: The Game of Life with selection

February 29, 2016 | mrtnj

Conway’s Game of life is probably the most famous cellular automaton, consisting of a grid of cells developing according simple rules. Today, we’re going to add mutation and selection to the game, and see let patterns evolve. The fate of a cell depends on the number cells that ...
[Read more...]

Toying with models: The Luria–Delbrück fluctuation test

February 19, 2016 | mrtnj

I hope that Genetics will continue running expository papers about their old classics, like this one by Philip Meneely about Luria & Delbrück (1943). Luria & Delbrück performed an experiment on bacteriophage resistance in Escherichia coli, growing bacterial cultures, exposing … Läs mer →
[Read more...]

R in genomics @ SciLifeLab, Solna

March 24, 2015 | mrtnj

Dear diary, I went to the Stockholm R useR group meetup on R in genomics at the Stockholm node of SciLifeLab. It was nice. If I had worked a bit closer I would attend meetups all the time. I even got to be pretentious with my notebook while waiting for ...
[Read more...]

Finding the distance from ChIP signals to genes

July 4, 2014 | mrtnj

I’ve had a couple of months off from blogging. Time for some computer-assisted biology! Robert Griffin asks on Stack Exchange about finding the distance between HP1 binding sites and genes in Drosophila melanogaster.  We can get a rough idea with some public chromatin immunoprecipitation data, R and the wonderful ... [Read more...]

More fun with %.% and %>%

March 27, 2014 | mrtnj

The %.% operator in dplyr allows one to put functions together without lots of nested parentheses. The flanking percent signs are R’s way of denoting infix operators; you might have used %in% which corresponds to the match function or %*% which is matrix multiplication. The %.% operator is also called chain, and ... [Read more...]
1 2 3 4

Never miss an update!
Subscribe to R-bloggers to receive
e-mails with the latest R posts.
(You will not see this message again.)

Click here to close (This popup will not appear again)