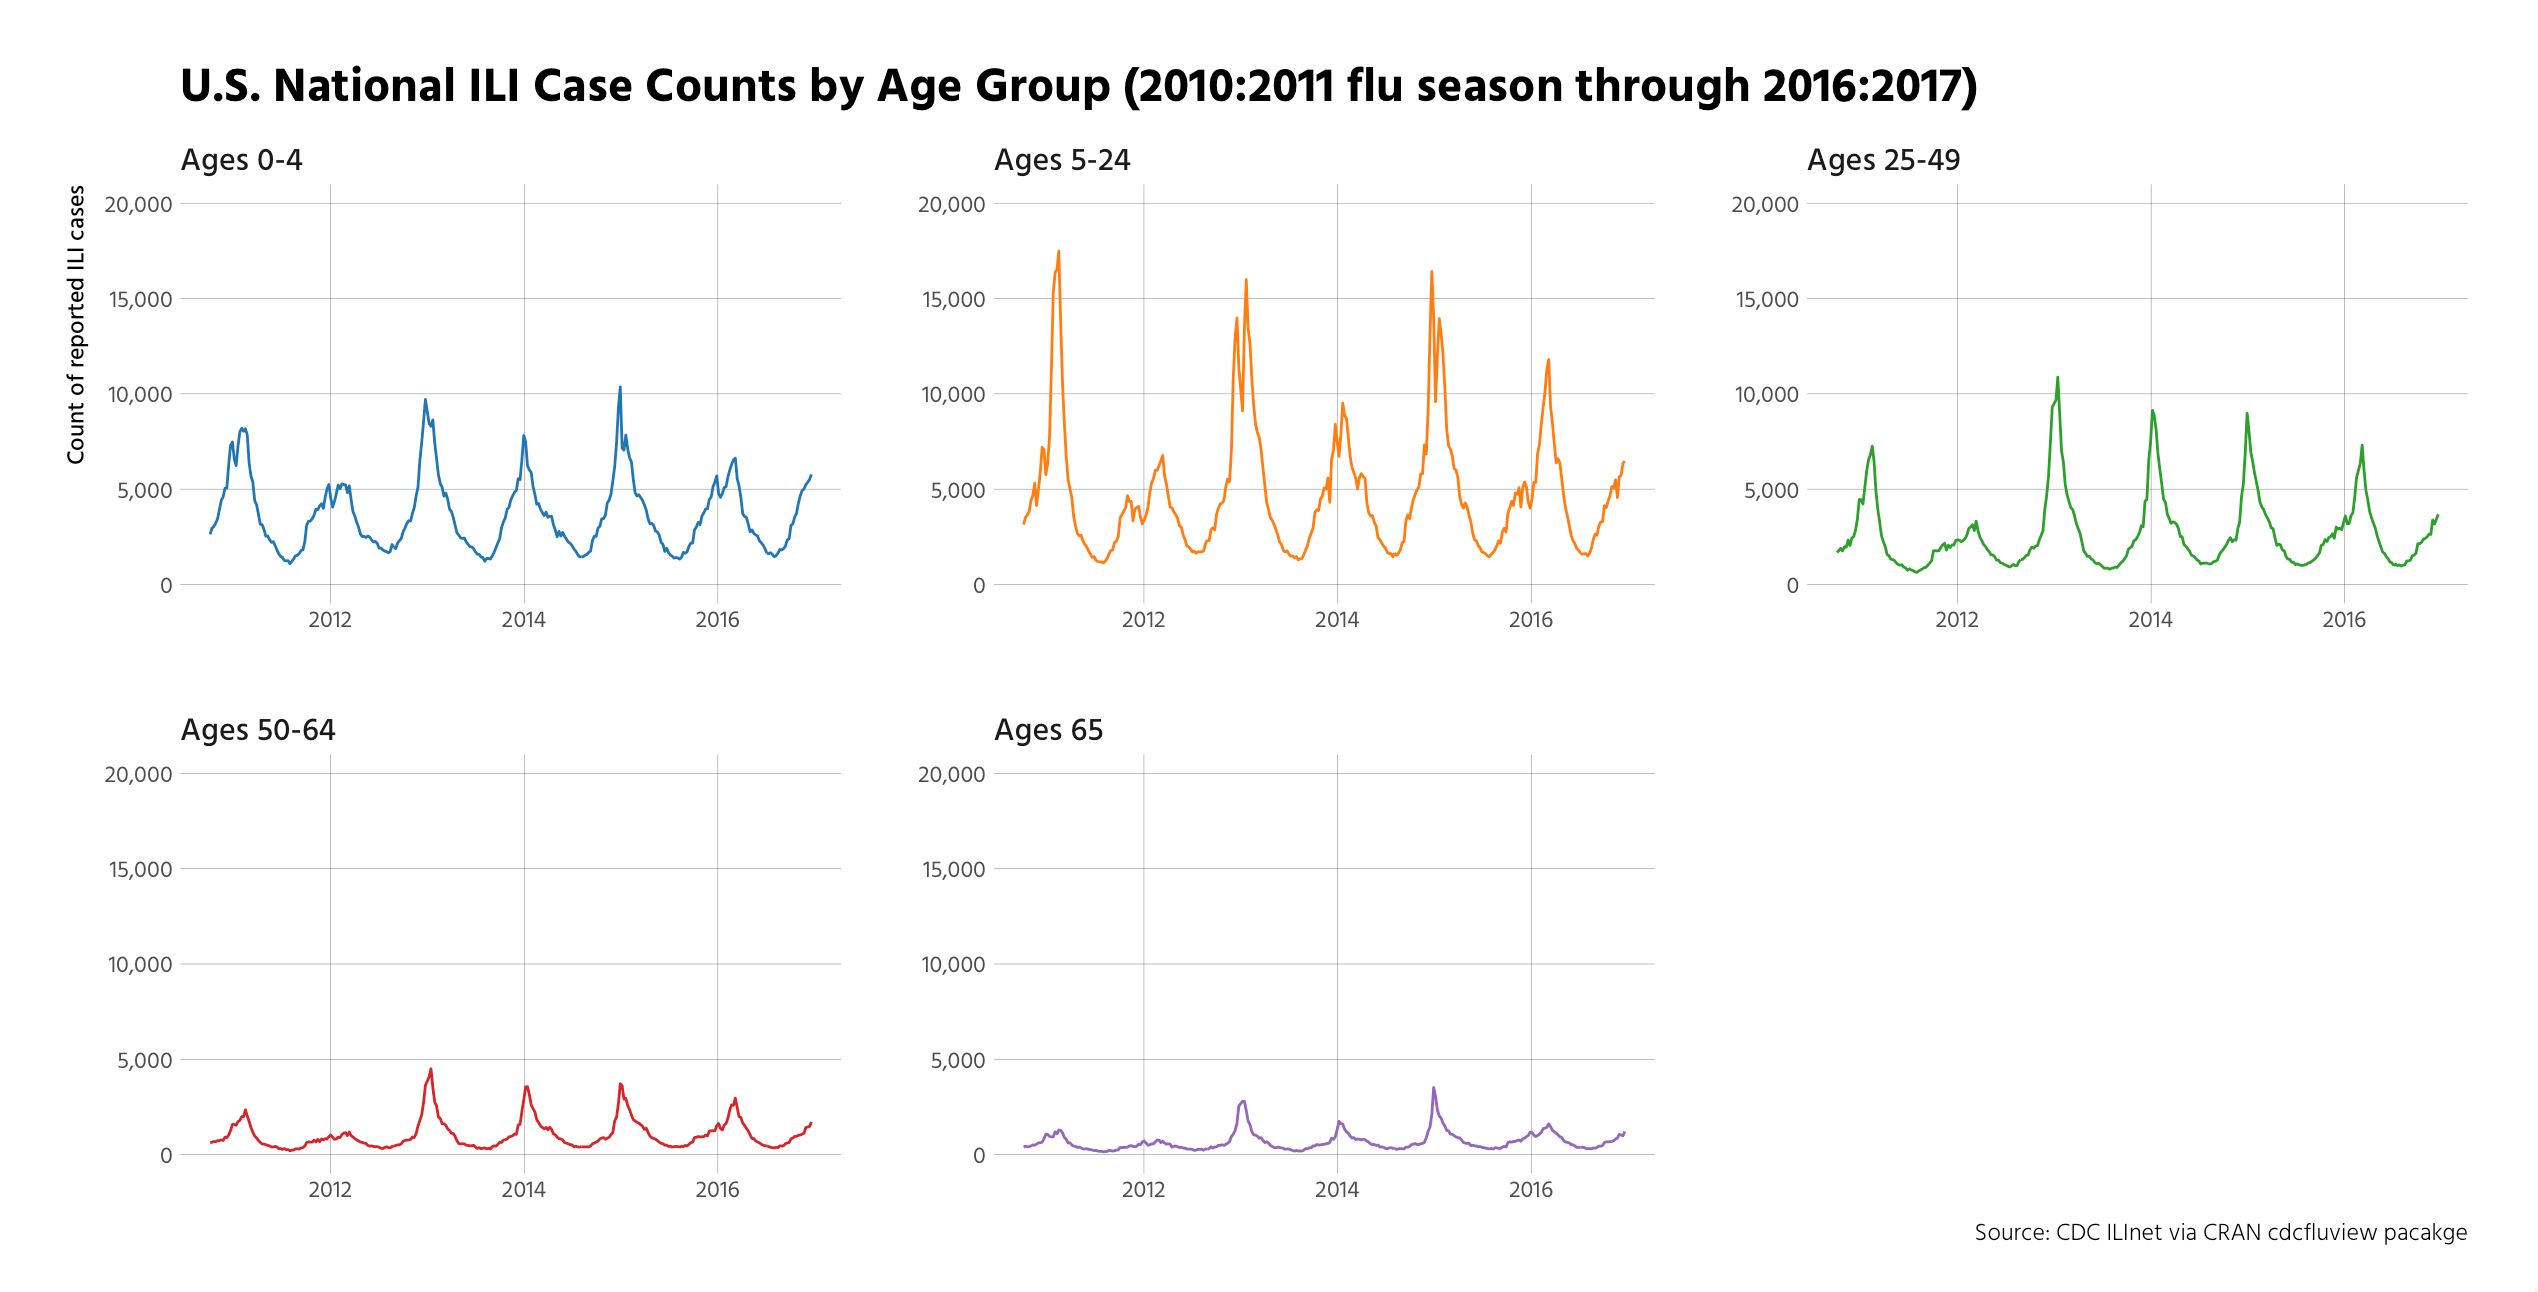
Articles by hrbrmstr

Easier Composite U.S. Choropleths with albersusa

March 29, 2016 | hrbrmstr

Folks who’ve been tracking this blog on R-bloggers probably remember this post where I showed how to create a composite U.S. map with an Albers projection (which is commonly referred to as AlbersUSA these days thanks to D3). I’m not sure why I didn’t think of ...
[Read more...]

Nuclear Animations in R

March 26, 2016 | hrbrmstr

@jsvine (Data Editor at BuzzFeed) cleaned up and posted a data sets of historical nuclear explosions earlier this week. I used it to show a few plotting examples in class, but it’s also a really fun data set to play around with: categorial countries; time series; lat/long pairs; ... [Read more...]

Using ProPublica “statefaces” in ggplot2

March 19, 2016 | hrbrmstr

I’m a huge fan of ProPublica. They have a super-savvy tech team, great reporters, awesome graphics folks and excel at data-driven journalism. Plus, they give away virtually everything, including data, text, graphics & tools. I was reading @USATODAY’s piece on lead levels in drinking water across America and saw ...
[Read more...]

Stacking the deck against treemaps

March 18, 2016 | hrbrmstr

So, I (unapologetically) did this to @Highcharts last week: @hrbrmstr Your loss of words inspired this post!! https://t.co/3KO0BP0k0u @hadleywickham @ma_salmon @tdmv @bearloga @rushworth_a @awhstin— Highcharts (@Highcharts) March 18, 2016 They did an awesome makeover (it’s interactive if you follow the link): And, I’...
[Read more...]

Hy-phen-ate All The Things! (in R)

March 18, 2016 | hrbrmstr

hyphenatr–what may be my smallest package ever–has just hit CRAN. It, well, hyphenates words using libhyphen (a.k.a. libhnj). There are no external dependencies (i.e. no brew install, apt get, et. al. required) and it compiles on everything CRAN supports including Windows. I started coding this ... [Read more...]

Supreme Annotations

March 16, 2016 | hrbrmstr

This is a follow up to a twitter-gist post & to the annotation party we’re having this week I had not intended this to be “Annotation Week” but there was a large, positive response to my annotation “hack” post. This reaction surprised me, then someone pointed me to this link ...
[Read more...]

Spinning Cycles in Box #4 To Take the Pies out of Pi Day

March 14, 2016 | hrbrmstr

I caught this tweet today: INSTEAD OF WORRYING ABOUT HOW OTHER DATA SCIENTISTS USE 🕒 PERHAPS @WSJGraphics COULD SPEND THEIR 🕒 LEARNING DATAVIZ pic.twitter.com/xrP2eUhaaQ— Metrics Hulk (@MetricsHulk) March 14, 2016 The WSJ folks usually do a great job, but this was either rushed or not completely thought through. There’s ...
[Read more...]

ggplot2で字幕 [Subtitles in ggplot2]

March 12, 2016 | hrbrmstr

Subtitles aren’t always necessary for plots, but I began to use them enough that I whipped up a function for ggplot2 that does a decent job adding a subtitle to a finished plot object. More than a few folks have tried their hand at this in the past and ...
[Read more...]

Some Light Image Processing & Creation With R

March 10, 2016 | hrbrmstr

A friend, we’ll call him Alen put a call out for some function that could take an image and produce a per-row “histogram” along the edge for the number of filled-in points. That requirement eventually scope-creeped to wanting “histograms” on both the edge and bottom. In, essence there was ...
[Read more...]

OS X XQuartz Vulnerability Test Using R

March 7, 2016 | hrbrmstr

It’s usually a good thing when my #rstats and infosec worlds collide. Unfortunately, this time it’s a script that R folk running on OS X can use to see if they are using a version of XQuartz that has a nasty vulnerability in the framework it uses to ... [Read more...]

Primary Plotting

March 7, 2016 | hrbrmstr

My wife tricked me into a partial-weekend project to try to get all the primary/caucus results to-date on a map (the whole us). This is challenging since not all states use counties as boundaries for aggregate results. I’m still piecing together some shapefiles for the primary/caucus summation ... [Read more...]

Capturing wild widgets with webshot

March 4, 2016 | hrbrmstr

NOTE: you won’t need to use this function if you use the development version of knitr Winston Chang released his webshot package to CRAN this past week. The package wraps the immensely useful phantomjs utility and makes it dirt simple to capture whole or partial web pages in R. ... [Read more...]

A Tale of Two Charting Paradigms: Vega-Lite vs R+ggplot2

February 28, 2016 | hrbrmstr

This post comes hot off the heels of the nigh-feature-complete release of vegalite (virtually all the components of Vega-Lite are now implemented and just need real-world user testing). I’ve had a few and seen a few questions about “why Vega-Lite”? I think my previous post gave some good answers ... [Read more...]

Making Faceted Heatmaps with ggplot2

February 14, 2016 | hrbrmstr

We were doing some exploratory data analysis on some attacker data at work and one of the things I was interested is what were “working hours” by country. Now, I don’t put a great deal of faith in the precision of geolocated IP addresses since every geolocation database that ... [Read more...]

Plot the new SVG R logo with ggplot2

February 11, 2016 | hrbrmstr

High resolution and SVG versions of the new R logo are finally available. I converted the SVG to WKT (file here) which means we can use it like we would a shapefile in R. That includes plotting! Here’s a short example of how to read that WKT and plot ...
[Read more...]
1 13 14 15 16 17 21

Never miss an update!
Subscribe to R-bloggers to receive
e-mails with the latest R posts.
(You will not see this message again.)

Click here to close (This popup will not appear again)