Articles by hrbrmstr

Mid-year R Packages Update Summary

July 24, 2016 | hrbrmstr

I been updating some existing packages and github-releasing new ones (before a CRAN push). Most are “cyber”-related, but there are some general purpose ones. Here’s a quick overview: docxtractr (CRAN, now, v0.2.0) was initially designed to make it easy to get data tables out of MS Word (docx) ... [Read more...]

Bridging The Political [Polygons] Gap with ggplot2

July 7, 2016 | hrbrmstr

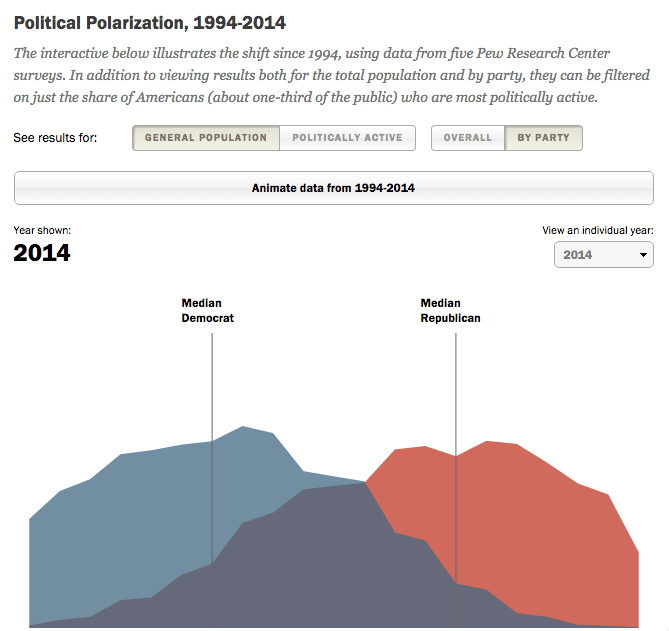
The @pewresearch folks have been collecting political survey data for quite a while, and I noticed the visualization below referenced in a Tableau vis contest entry: Those are filled frequency polygons, which are super-easy to replicate in ggplot2, especially since Pew even kind of made the data available via their ...
[Read more...]

Making “Time Rivers” in R

June 28, 2016 | hrbrmstr

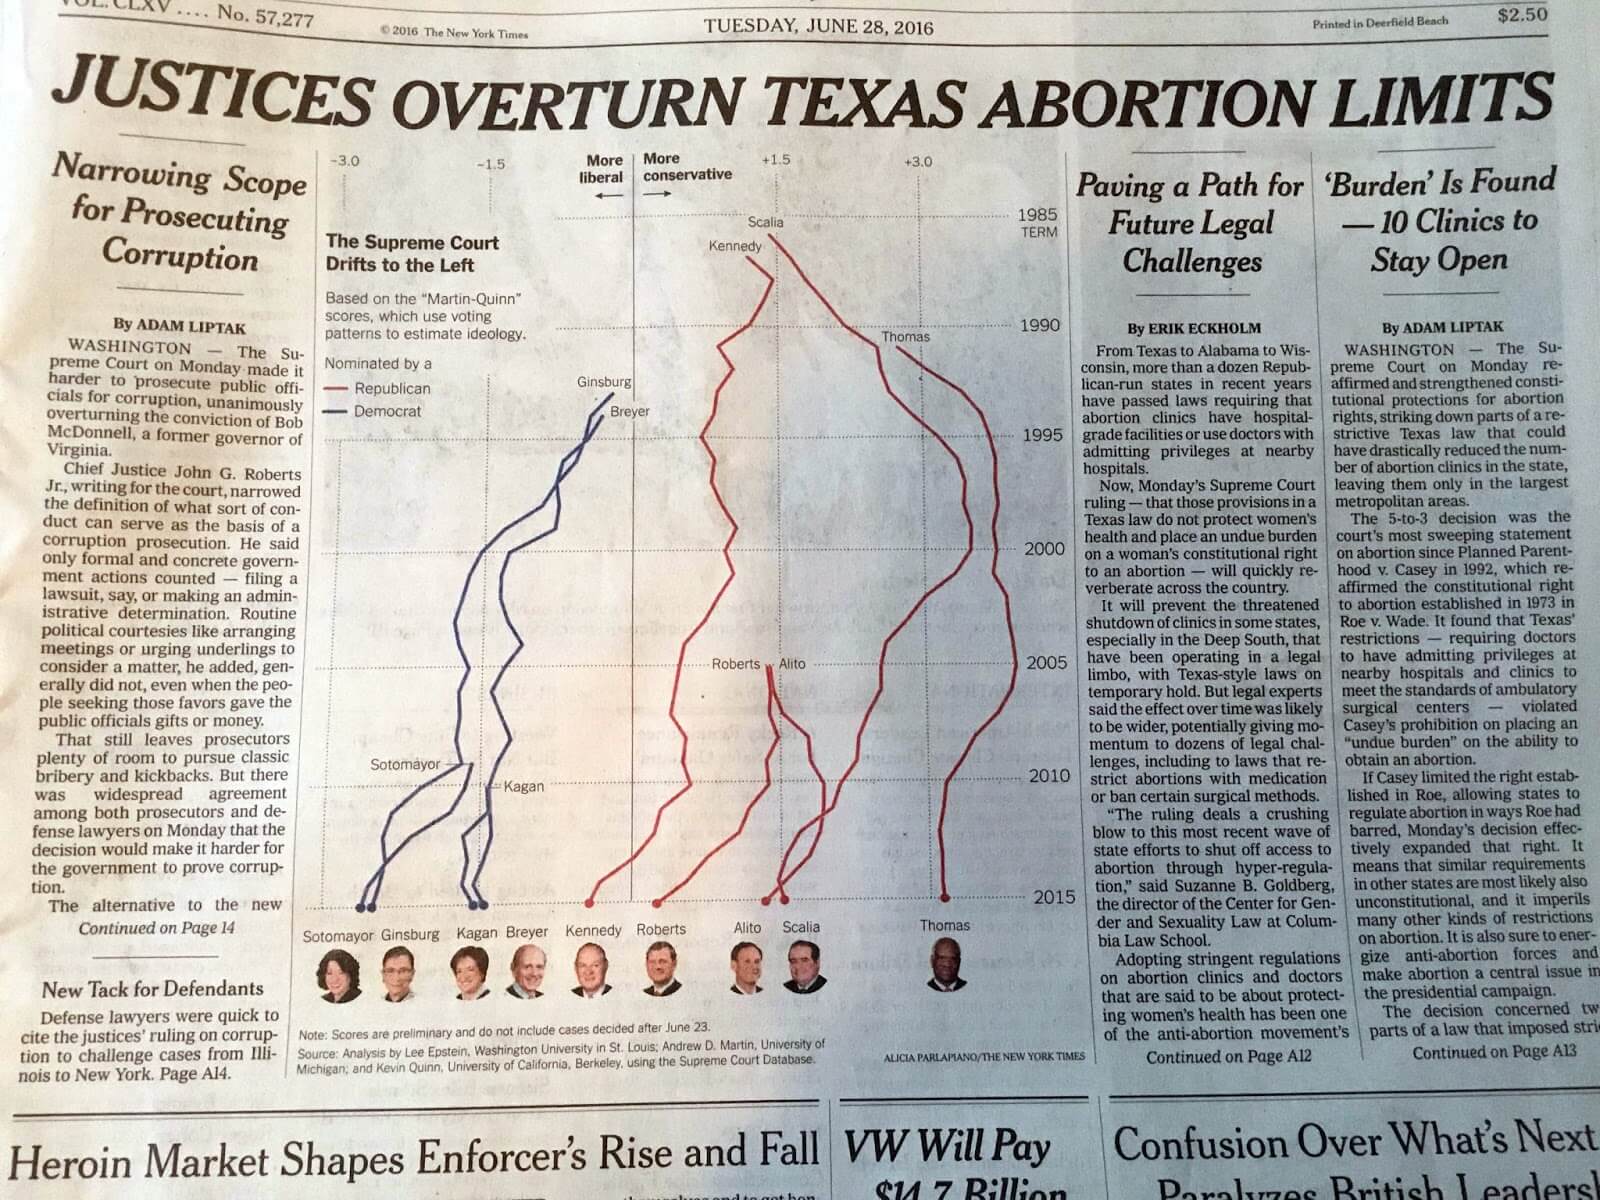
Once again, @albertocairo notices an interesting chart and spurs pondering in the visualization community with his post covering an unusual “vertical time series” chart produced for the print version of the NYTimes: I’m actually less concerned about the vertical time series chart component here since I agree with TAVE* ...
[Read more...]

A Call to Arms[list] Data Analysis!

June 19, 2016 | hrbrmstr

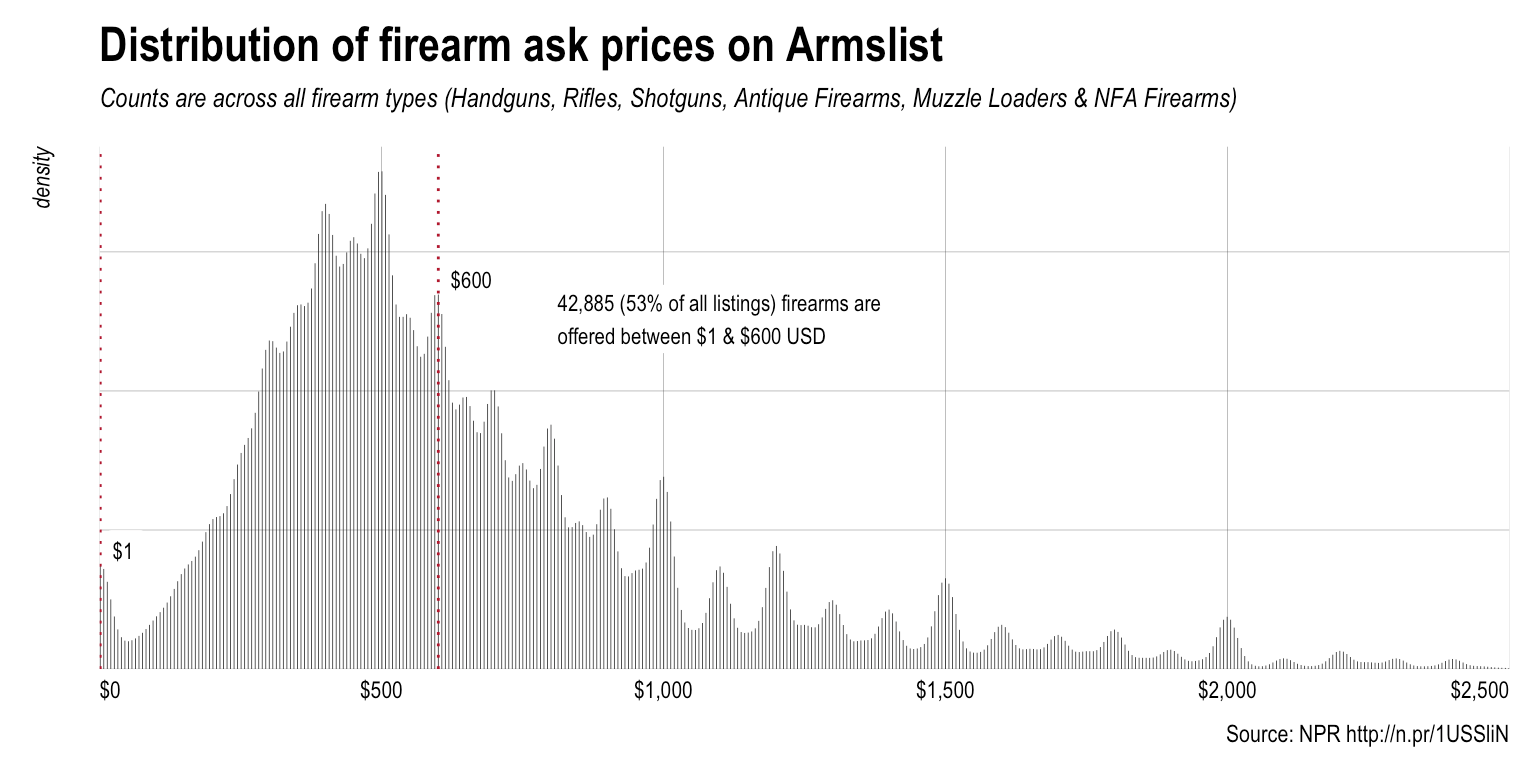
The NPR vis team contributed to a recent story about Armslist, a “craigslist for guns”. Now, I’m neither pro-“gun” or anti-“gun” since this subject, like most heated ones, has more than two sides. What I am is pro-data, and the U.S. Congress is so deep in ...
[Read more...]

On Whether Y-axis Labels Are Always Necessary

June 12, 2016 | hrbrmstr

The infamous @albertocairo blogged about a nice interactive piece on German company tax avoidance by @ProPublica. Here’s a snapshot of their interactive chart: Dr. Cairo (his PhD is in the bag as far as I’m concerned :-) posited: Isn’t it weird that the chart doesn’t have ...
[Read more...]

Global Temperature Change in R & D3 (without the vertigo)

May 14, 2016 | hrbrmstr

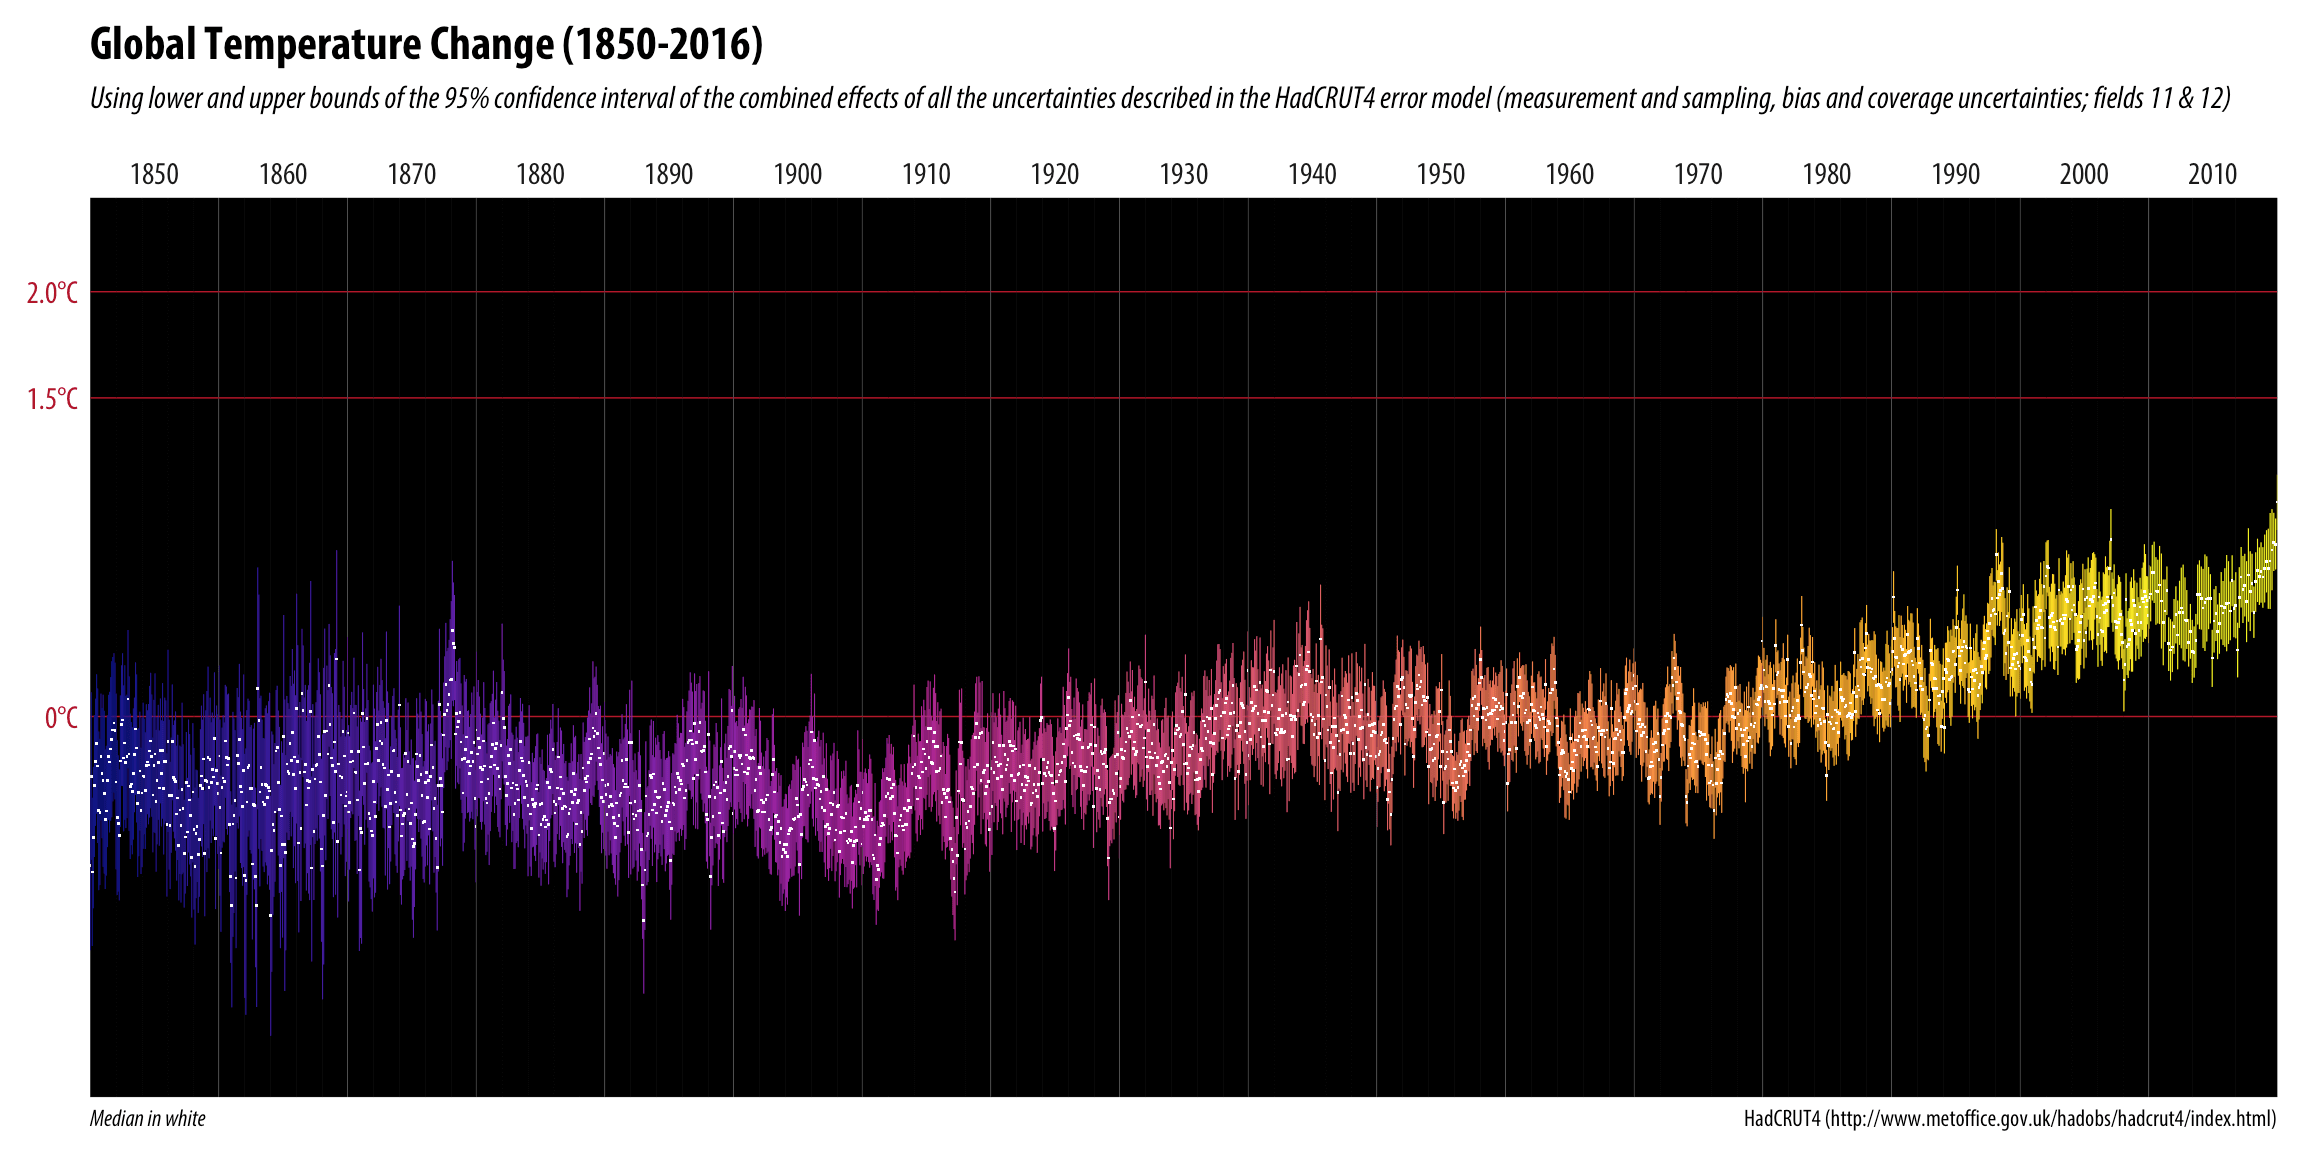
This made the rounds on social media last week: Spiraling global temperatures from 1850-2016 (full animation) https://t.co/YETC5HkmTr pic.twitter.com/Ypci717AHq— Ed Hawkins (@ed_hawkins) May 9, 2016 One of the original versions was static and was not nearly as popular, but—as you can see—this ...
[Read more...]

New #rstats Podcast – R World News

May 10, 2016 | hrbrmstr

Keeping up with R-related news on Twitter, GitHub, CRAN & even R-Bloggers (et al) can be an all-encompassing task that may be fun, but doesn’t always make it easy to get work done. There is so much going on in the R community that we (myself and @jayjacobs) felt there ... [Read more...]

(ggplot2) Exercising with (ggalt) dumbbells

April 17, 2016 | hrbrmstr

I follow the most excellent Pew Research folks on Twitter to stay in tune with what’s happening (statistically speaking) with the world. Today, they tweeted this excerpt from their 2015 Global Attitudes survey: The age gap in social media use around the world https://t.co/0Dq1PcbExG pic.twitter....
[Read more...]

52Vis Week #3 – Waste Not, Want Not

April 13, 2016 | hrbrmstr

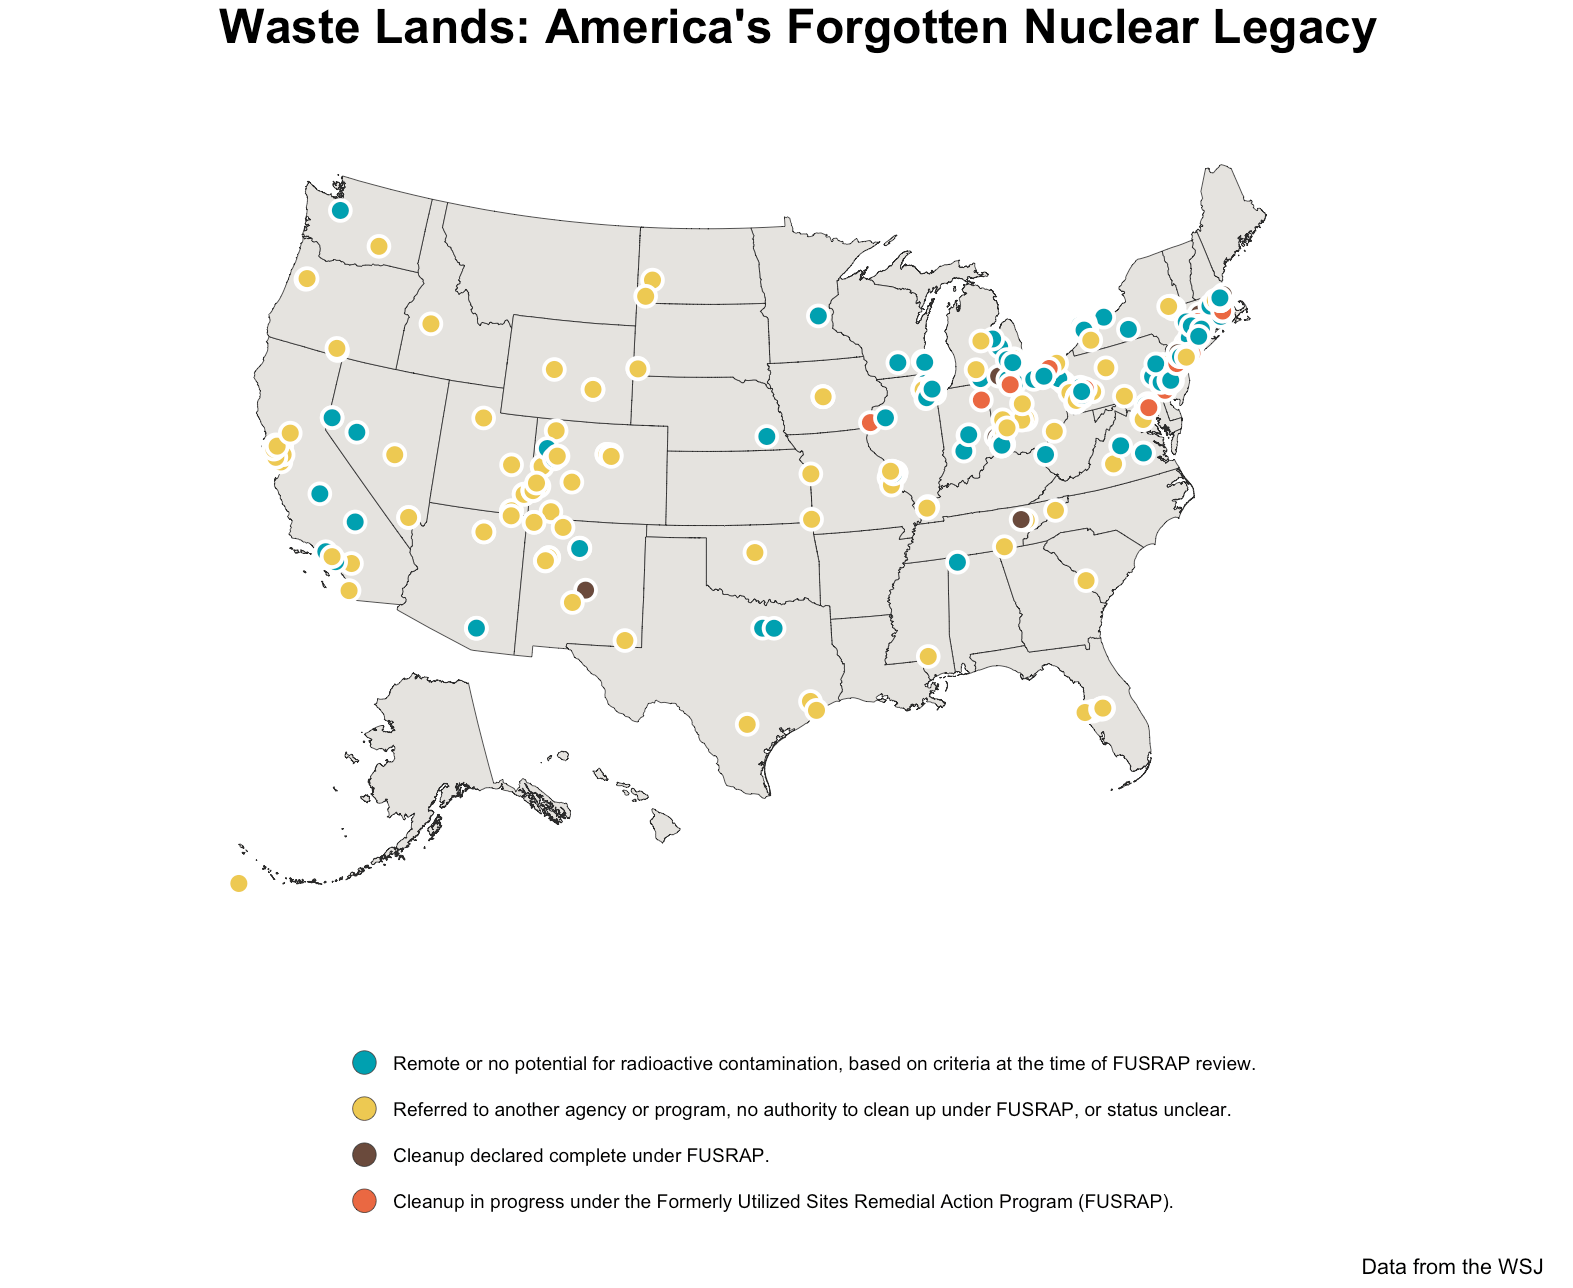
The Wall Street Journal did a project piece a while back in the “Waste Lands: America’s Forgotten Nuclear Legacy”. They dug through Department of Energy and CDC data to provide an overview of the lingering residue of this toxic time in America’s past (somehow, I have to believe ...
[Read more...]

52 Vis Week #2 Wrap Up

April 13, 2016 | hrbrmstr

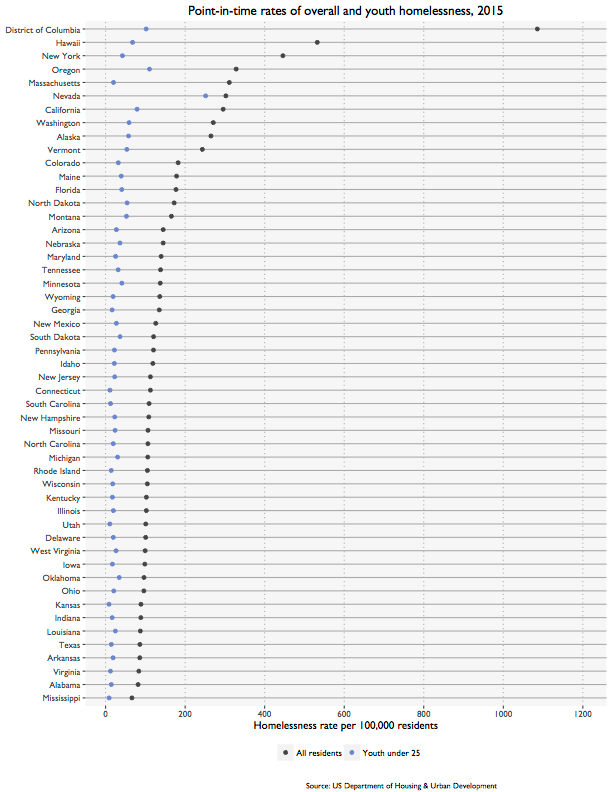
I’ve been staring at this homeless data set for a few weeks now since I’m using it both here and in the data science class I’m teaching. It’s been one of the most mindful data sets I’ve worked with in a while. Even when reduced ...
[Read more...]

52 Vis Week 1 Winners!

April 13, 2016 | hrbrmstr

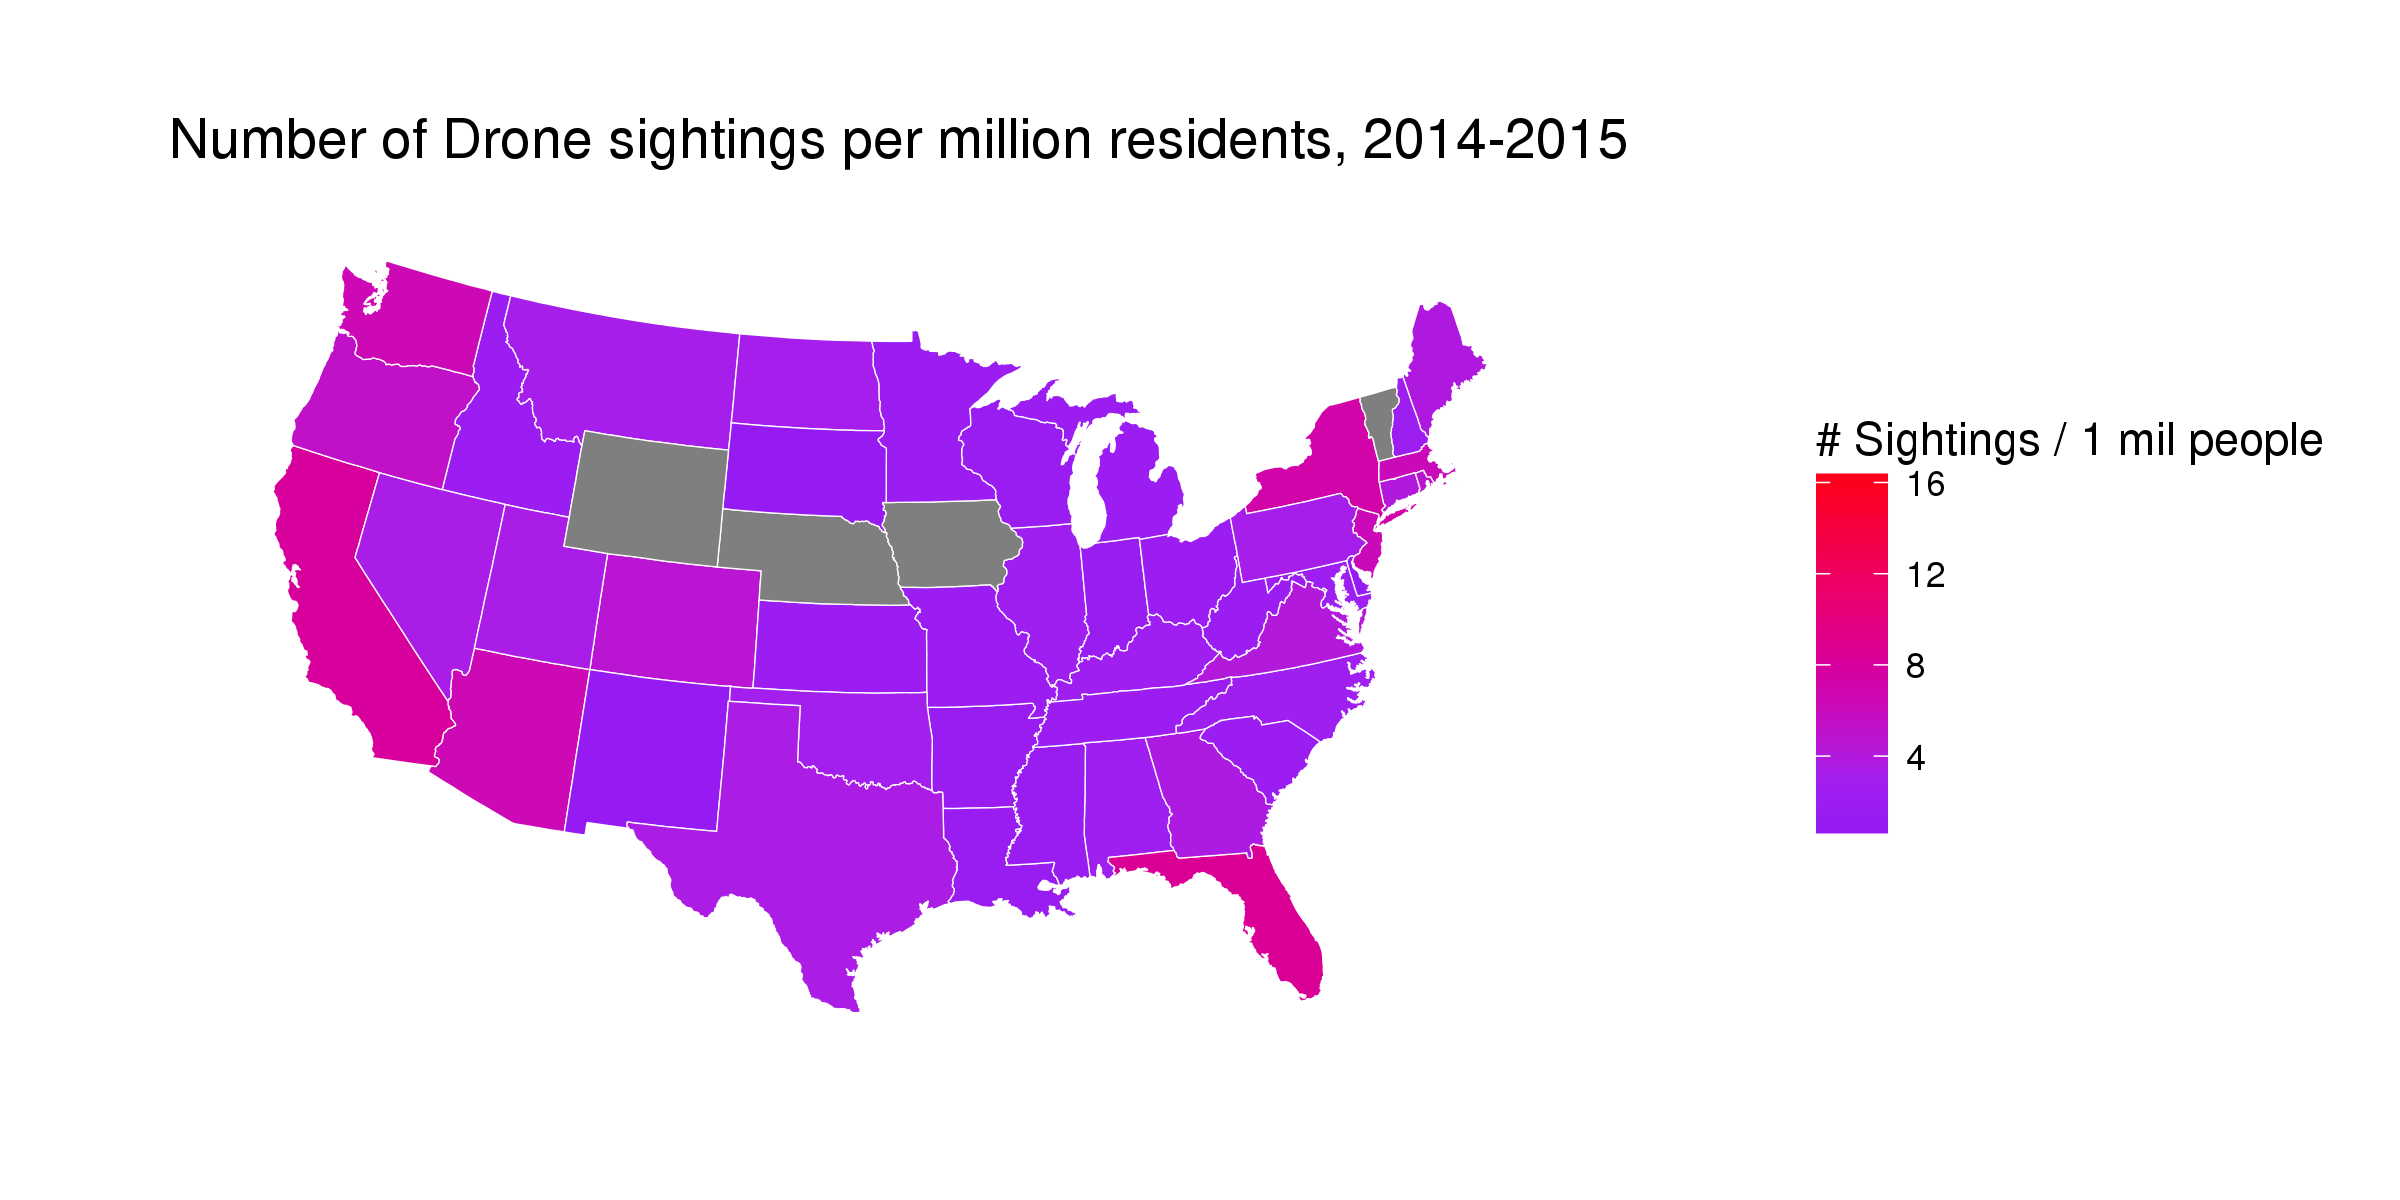
The response to 52Vis has exceeded expectations and there have been great entries for both weeks. It’s time to award some prizes! Week 1 – Send in the Drones I’ll take this week in comment submission order (remember, the rules changed to submission via PR in Week 2). NOTE: WordPress seems ...
[Read more...]

Beating lollipops into dumbbells

April 12, 2016 | hrbrmstr

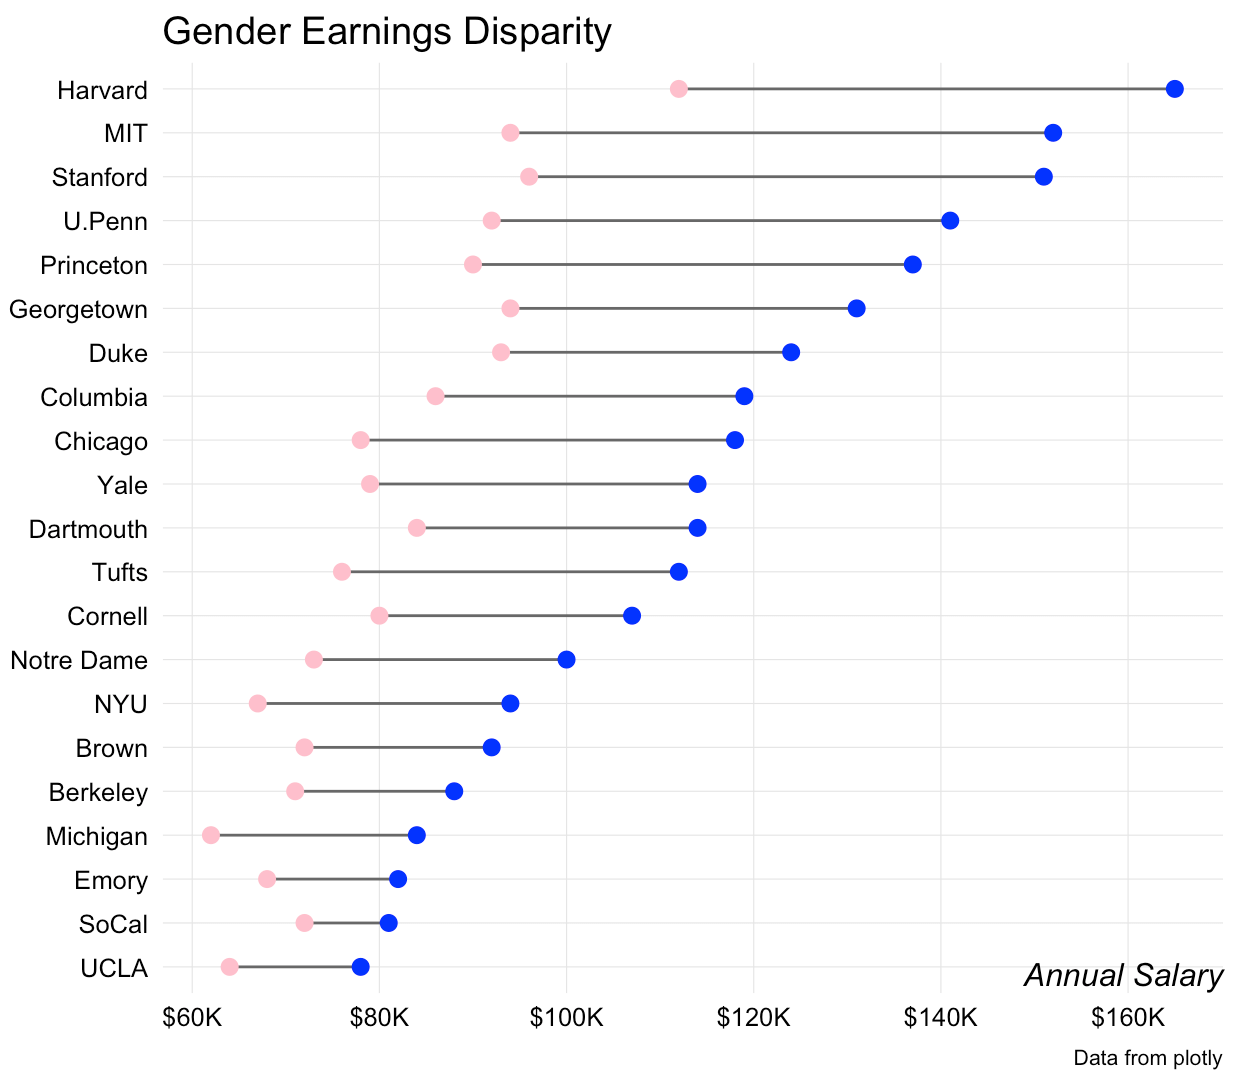
Shortly after I added lollipop charts to ggalt I had a few requests for a dumbbell geom. It wasn’t difficult to do modify the underlying lollipop Geoms to make a geom_dumbbell(). Here it is in action: library(ggplot2) library(ggalt) # devtools::install_github("hrbrmstr/ggalt") library(dplyr)   # from: ...
[Read more...]

Clandestine DNS lookups with gdns

April 10, 2016 | hrbrmstr

Google recently announced their DNS-over-HTTPS API, which “enhances privacy and security between a client and a recursive resolver, and complements DNSSEC to provide end-to-end authenticated DNS lookups”. The REST API they provided was pretty simple to wrap into a package and I tossed in some SPF functions that I had ...
[Read more...]
1 12 13 14 15 16 21

Never miss an update!
Subscribe to R-bloggers to receive
e-mails with the latest R posts.
(You will not see this message again.)

Click here to close (This popup will not appear again)