Articles by Corey Chivers

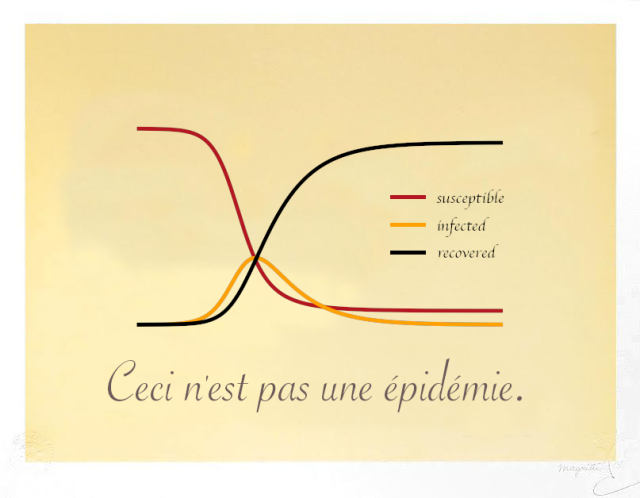
The Treachery of Models

April 20, 2020 | Corey Chivers

In Magritte’s famous 1929 painting The Treachery of Images, a pipe is depicted with the caption “Ceci n’est pas une pipe“, French for “This is not a pipe”. The seemingly dissonant statement under what is a very clearly depicted pipe forces the viewer to confront the distinction between the ...
[Read more...]

Eigenvectors from Eigenvalues – a NumPy implementation

November 17, 2019 | Corey Chivers

I was intrigued by the recent splashy result showing how eigenvectors can be computed from eigenvalues alone. The finding was covered in Quanta magazine and the original paper is pretty easy to understand, even for a non-mathematician. Being a non-mathematician myself, I tend to look for insights and understanding via ...
[Read more...]

Germination Project Fellows come to Penn

August 9, 2019 | Corey Chivers

I was recently fortunate to be invited to speak with an impressive group of high-school students as a part of the Germination Project. They came to Penn to learn about innovation in health care and I spoke with them about how we’re using Data Science to improve patient outcomes.
[Read more...]

Visualizing classifier thresholds

November 13, 2017 | Corey Chivers

Lately I’ve been thinking a lot about the connection between prediction models and the decisions that they influence. There is a lot of theory around this, but communicating how the various pieces all fit together with the folks who will use and be impacted by these decisions can be ...
[Read more...]

Speaking at DataPhilly February 2016

February 5, 2016 | Corey Chivers

The next DataPhilly meetup will feature a medley of machine-learning talks, including an Intro to ML from yours truly. Check out the speakers list and be sure to RSVP. Hope to see you there! Thursday, February 18, 2016 6:00 PM to 9:00 PM Speakers: Corey Chivers Randy Olson Austin Rochford Corey Chivers (Penn Medicine) ... [Read more...]

R style default plot for Pandas DataFrame

March 28, 2015 | Corey Chivers

The default plot method for dataframes in R is to show each numeric variable in a pair-wise scatter plot. I find this to be a really useful first look at dataset, both to see correlations and joint distributions between variables, but also to quickly diagnose potential strangeness like bands of ... [Read more...]

One datavis for you, ten for me

September 14, 2014 | Corey Chivers

Over the years of my graduate studies I made a lot of plots. I mean tonnes. To get an extremely conservative estimate I grep’ed for every instance of “plot(” in all of the many R scripts I wrote over the past five years. The actual number is very likely ... [Read more...]

Simudidactic

November 21, 2013 | Corey Chivers

[This article was first published on bayesianbiologist » Rstats, and kindly contributed to R-bloggers]. (You can report issue about the content on this page here) Want to [Read more...]

Follow up to Johnson et al Post

October 20, 2013 | Corey Chivers

Last week I posted a comment on a paper by Neil Johnson and colleagues that I now regret. The comment amounted to a bit of statistical pedantry on my part regarding some of the wording in the paper. It was my wording in this post, and specifically the title, which ... [Read more...]

Calculating AUC the hard way

October 10, 2013 | Corey Chivers

The Area Under the Receiver Operator Curve is a commonly used metric of model performance in machine learning and many other binary classification/prediction problems. The idea is to generate a threshold independent measure of how well a model is able to distinguish between two possible outcomes. Threshold independent here ... [Read more...]

Time-series forecasting: Bike Accidents

August 20, 2013 | Corey Chivers

About a year ago I posted this video visualization of all the reported accidents involving bicycles in Montreal between 2006 and 2010. In the process I also calculated and plotted the accident rate using a monthly moving average. The results followed a pattern that was for the most part to be expected. ... [Read more...]
1 2 3 4

Never miss an update!
Subscribe to R-bloggers to receive
e-mails with the latest R posts.
(You will not see this message again.)

Click here to close (This popup will not appear again)