
Track Concordance Charts
Want to share your content on R-bloggers? click here if you have a blog, or here if you don't.
Since getting started with generating templated R reports a few weeks ago, I’ve started spending the odd few minutes every race weekend around looking at ways of automating the generation of F1 qualifying and race reports.
Im yesterday’s race, some of the commentary focussed on whether MAS had given BOT an “assist” in blocking VET, which got me thinking about better ways of visualising whether drivers are stuck in traffic or not.
The track position chart makes a start at this, but it can be hard to focus on a particular driver (identified using a particular character to infill the circle marker for that driver). The race leader’s track position ahead is identified from the lap offset race leader marker at the right hand side of the chart.

One way to help keep track of things from the perspective of a particular driver, rather than the race leader, is to rebase the origin of the x-axis relative to the that driver.
In my track chart code, I use a dataframe that has a trackdiff column that gives a time offset on track to race leader for each lead lap.
track_encoder=function(lapTimes){
  #Find the accumulated race time at the start of each leader's lap
  lapTimes = ddply(lapTimes, .(leadlap), transform, lstart = min(acctime))

  #Find the on-track gap to leader
  lapTimes['trackdiff'] = lapTimes['acctime'] - lapTimes['lstart']
  lapTimes
}
Rebasing for a particular driver simply means resetting the origin with respect to that time, using the trackdiff time for one driver as an offset for the others, to create a new trackdiff2 for use on the x-axis.
#I'm sure there must be a more idiomatic way of doing this?
rebase=lapTimes[lapTimes['code']==code,c('leadlap','trackdiff')]
rebase=rename(rebase,c('trackdiff'='trackrebase'))
lapTimes=merge(lapTimes,rebase,by='leadlap')
lapTimes['trackdiff2']=lapTimes['trackdiff']-lapTimes['trackrebase']
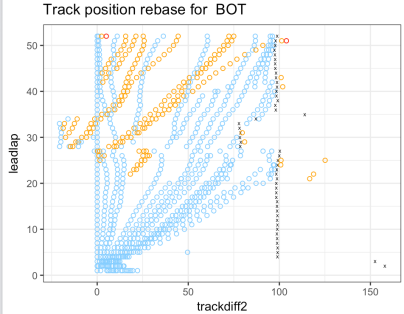
Here’s how it looks for MAS:

But not so useful for BOT, who led much of the race:

This got me thinking about text concordances. In the NLTK text analysis package, the text concordance function allows you to display a search term centred in the context in which it is found:

The concordance view finds the location of each token and then displays the search term surrounded by tokens in neighbouring locations, within a particular window size.
I spent a chunk of time wondering how to do this sensibly in R, struggling to identify what it was I actually wanted to do: for a particular driver, find the neighbouring cars in terms of accumulated laptime on each lap. After failing to see the light for more an hour or so, I thought of it in terms of an SQL query, and the answer fell straight out – for the specified driver on a particular lead leadlap, get their accumulated laptime and the rows with accumulated laptimes in a window around it.
inscope=sqldf(paste0('SELECT l1.code as code,l1.acctime-l2.acctime as acctimedelta,
l2.lap-l1.lap as lapdelta, l2.lap as focuslap
FROM lapTimes as l1 join lapTimes as l2
WHERE l1.acctime < (l2.acctime + ', abs(limits[2]), ') AND l1.acctime > (l2.acctime - ', abs(limits[1]),')
AND l2.code="',code,'";'))
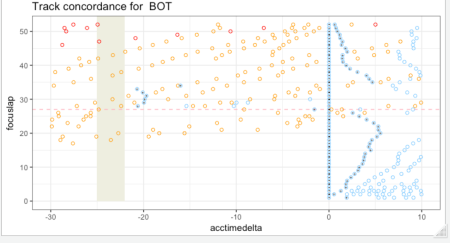
Plotting against the accumalated laptime delta on the x-axis gives a chart like this:

If we add in horizontal rules to show laps where the specified driver pitted and vertical bars to show pit windows, we get a much richer particular of the race from the point of view of the driver.

Here’s how it looks from the perspective of BOT, who led most of the race:

Different symbols inside the markers can be used to track different drivers (in the above charts, BOT and VET are highlighted). The colours are used to identify whether or not cars on the same lap as the specified driver, are cars on laps ahead for shades of blue then green (as per “blue flag”) and orange to red for cars on increasing laps behind (i.e. backmarkers from the perspective of the specified driver). If a marker is light blue, that car is on the same lap and you’re racing…
All in all, I’m pretty chuffed (for now!) with how that chart came together.
And a new recipe to add to the Wrangling F1 Data With R book, I guess..
PS in response to [misunderstanding…] a comment from @sidepodcast, we also have control over the concordance window size, and the plotsize:
Generating hi-res versions in other file formats is also possible.
Just got to wrap it all up in a templated report now…
PPS On the track position charts, I just noticed that where cars are lapped, they fall off the radar… so I’ve added them in behind the leader to keep the car count correct for each leadlap…

R-bloggers.com offers daily e-mail updates about R news and tutorials about learning R and many other topics. Click here if you're looking to post or find an R/data-science job.
Want to share your content on R-bloggers? click here if you have a blog, or here if you don't.