
Three R Shiny tricks to make your Shiny app shines (3/3): Buttons to delete, edit and compare Datatable rows
Want to share your content on R-bloggers? click here if you have a blog, or here if you don't.
In this tutorials sequence, we are going to see three tricks to do the following in a Shiny app:
- Add Next and Previous buttons to navigate in a tabBox
- Build a non completely collapsible sidebar to keep the icon visible on collapse
- Add button on a datatable output to delete/modify/ do an action on a given row.
Today, we are going to see how to add buttons in each rows of a datatable to delete, edit or compare it with other rows.
The app is live here.
3. Buttons to delete, edit and compare Datatable rows
Here is what we want to achieve:

As you can seen, the final application offer a lot of functionalities, like selecting row with checkboxes, comparing, deleting them and also modifying them.
Even though you can select the rows via the classical datatable functions, checkboxes make it more visual for the users (he knows there is something it can do). In addition to this, the button are a clear call to action so that the users do not have to serach how to do the different actions.
a.It all begins with a data.table (or a datatable)
To begin with, we will only display a classic data.table, generate some fake datas in our app.
ui.R
library(shiny)
library(shinydashboard)

dashboardPage(dashboardHeader(disable = T),
 dashboardSidebar(disable = T),
 dashboardBody(uiOutput("MainBody")
 )
 )
The ui is very classic, since most of the content is dynamic, we will generate the page and elements in the server.
server.R
library(shinydashboard)
library(data.table)
library(DT)

shinyServer(function(input, output) {

###Creating reactive values since we will need to modify the table with events and triggers
 vals=reactiveValues()
 vals$Data=data.table(
 Brands=paste0("Brand",1:10),
 Forecasted_Growth=sample(1:20,10),
 Last_Year_Purchase=round(rnorm(10,1000,1000)^2),
 Contact=paste0("Brand",1:10,"@email.com")
 )

##The Body is classic, we just used the group button to improve the render
##And to show the user the actions are related
 output$MainBody=renderUI({
   fluidPage(
    box(width=12,
     h3(strong("Actions on datatable with buttons"),align="center"),
     hr(),
     column(6,offset = 6,
##Grouped button
       HTML('') ),
##Rendering the datatable
column(12,dataTableOutput("Main_table")) })
##The code may seem weird but we will modify it later
output$Main_table=renderDataTable({ DT=vals$Data datatable(DT)} )
Data generation: The apps create fakes yearly sales data for 10 brands, with a name, an email and a fake estimated growth. The data is purely cosmetic.
Main Body: The body contains a title, three buttons which are grouped using the html div btn-group. When Shiny generates the html code, the div will encapsulate the action buttons which will be showed as grouped.
Storing the table in a reactive value: Since we will want to perform action on the data with buttons and eventObserver the modifications of the data will be done with side effects. Hence reactiveValues are a must.
b. On which we added some buttons
Now, lets add the buttons to our datatable. Basically, they will be added through html code and the datatble will be asked not to escape strings.
 output$Main_table=renderDataTable({
DT=vals$Data
DT[["Select"]]<-paste0('<input type="checkbox" name="row_selected" value="Row',1:nrow(vals$Data),'">
')

DT[["Actions"]]<-
paste0('
<div class="btn-group" role="group" aria-label="Basic example">
<button type="button" class="btn btn-secondary delete" id=delete_',1:nrow(vals$Data),'>Delete</button>
<button type="button" class="btn btn-secondary modify"id=modify_',1:nrow(vals$Data),'>Modify</button>
</div>
')
datatable(DT,
escape=F)}
)
Checkboxes: The checkboxes will be used to select the rows on which the user want to perform some actions (Deletion, comparison). Since they all have the same name it will be easy to access their value through JS. We will get the value of the row by deleting the ‘Row_’ from the checkbox value.
Actions Buttons: Each row will contain a group of two buttons, one to delete the row and the other one to modify it. Again, the app will access the row to delete and the action to do through the button ID.
Escape: Perhaps you noticed the escape=F option, by using it, datatable will render the buttons according to their HTML codes instead of strings.
c. But these buttons were doing nothing.
No matter you click on the buttons or not, nothing will happen. They need to be linked with the Shiny App. First, let’s link the new row button.
We will just add an event observer in the server which will add a new row to vals$Data
observeEvent(input$Add_row_head,{
 new_row=data.frame(
 Brands="NewBrand",
 Forecasted_Growth=sample(1:20,1),
 Last_Year_Purchase=round(rnorm(1,1000,1000)^2),
 Contact="[email protected]")
 vals$Data=rbind(vals$Data,new_row)
 })
The observer is just generating a new row and appending it to vals$Data.
d. Getting the selected row/ticked box in Shiny.
Now, to be able to compare the selected row and to delete them, we need to create a new Shiny input with the list of selected checkbox.
This can be done adding a js script at the end of output$MainBody
 tags$script(HTML('$(document).on("click", "input", function () {
var checkboxes = document.getElementsByName("row_selected");
var checkboxesChecked = [];
for (var i=0; i<checkboxes.length; i++) {

if (checkboxes[i].checked) {
checkboxesChecked.push(checkboxes[i].value);
}
}
Shiny.onInputChange("checked_rows",checkboxesChecked);
})'))
Line by line:
First we are adding a new script, the HTML() is used to avoid escaping, which may lead to some weird stuff with the ‘>’.
Then when the user is clicking on an input, the script runs a function.
We are storing all the checkboxes and we create an empty arrow that will be filled with the id of ticked checkbox.
The last line is assigning the id of checked boxes to input$checked rows.
e. Now, let’s delete and compare rows
Now, the app can access the list of checked rows. Let’s delete these ones through an observe event (to be added in the shinyServer function)
observeEvent(input$Del_row_head,{
 row_to_del=as.numeric(gsub("Row","",input$checked_rows))
 vals$Data=vals$Data[-row_to_del]}
 )
Nothing fancy in it, the value of rows to delete is gotten by deleting the “Row” part of the input. Then, the value of vals$Data is updated.
To compare the rows, the code is similar.
observeEvent(input$Compare_row_head,
  {
   row_to_del=as.numeric(gsub("Row","",input$checked_rows))
   number_brands=length(row_to_del)
   vals$fake_sales=data.table(
       month=rep(1:12,number_brands),
       sales=round(rnorm(12*number_brands,1000,1000)^2)/12,
       Brands=rep(vals$Data[row_to_del,Brands],each=12)
      )
 vals$fake_sales[,Brands:=as.factor(Brands)]
 showModal(fake_sales_modal)
 }
 )
As previously, the observer get the selected rows, then some fakes data are generated and the modal containing the plot is shown. The modal is generate using the code below:
 fake_sales_modal=modalDialog(
fluidPage(
h3(strong("Monthly sales of selected brands"),align="center"),
plotOutput('sales_plot')
),
size="l"
)

output$sales_plot=renderPlot({
require(ggplot2)
ggplot(vals$fake_sales,aes(x=month,y=sales,color=Brands))+geom_line()
})
The plot needs to be outside of the modal since it is dependent on vals$fake_sales which is reactive.
Now when you click on the compare or delete selected rows, the actions should happen correctly.
f. Inrow button deletion.
Now, let’s focus on deleting a row with the inrow button. As previously, we first need to link the button with a Shiny Input, this will be done through a small JS script to add at the end of output$MainBody
tags$script("$(document).on('click', '#Main_table button', function () {
 Shiny.onInputChange('lastClickId',this.id);
 Shiny.onInputChange('lastClick', Math.random())
 });")
When a button in output$Main_Table is clicked, input$lastClickId got assigned the id of this button and input$lastClick got assigned a random value.
The last click is used to detect the click (for instance when a button is clicked twice, the id won’t change and hence cannot be observed).
The app will observe input$lastClick:
observeEvent(input$lastClick,
 {
 if (input$lastClickId%like%"delete")
 {
 row_to_del=as.numeric(gsub("delete_","",input$lastClickId))
 vals$Data=vals$Data[-row_to_del]
 }
 else if (input$lastClickId%like%"modify")
 {
 showModal(modal_modify)
 }
 }
 )
Below is the structure of the modal, it is basically a page with a data.table and an action button to trigger the save of the modification.
 modal_modify=modalDialog(
fluidPage(
h3(strong("Row modification"),align="center"),
hr(),
dataTableOutput('row_modif'),
actionButton("save_changes","Save changes"),

),
size="l"
)
The process to delete the row is the same as with checkbox selection. We are only keeping the end of the id which contains the number of the row to delete.
g.One modal to modify them all.
Now, we want to be able to modify a given line of the data.table. To do see, we will pop a modal with text field when the user click on the modify button.
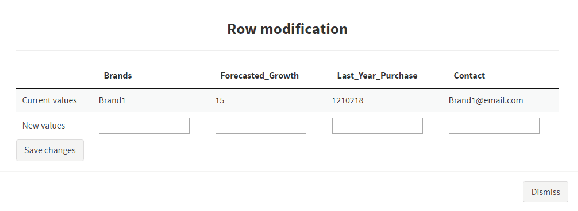
The datatable inside has the following structure:
output$row_modif<-renderDataTable({
selected_row=as.numeric(gsub("modify_","",input$lastClickId))
old_row=vals$Data[selected_row]
row_change=list()
for (i in colnames(old_row))
{
if (is.numeric(vals$Data[[i]]))
{
row_change[[i]]<-paste0('<input class="new_input" type="number" id=new_',i,'>
')
}
else
row_change[[i]]<-paste0('<input class="new_input" type="text" id=new_',i,'>
')
}
row_change=as.data.table(row_change)
setnames(row_change,colnames(old_row))
DT=rbind(old_row,row_change)
rownames(DT)<-c("Current values","New values")
DT

},escape=F,options=list(dom='t',ordering=F),selection="none"
)
So, we are putting the old values in the first row and the second is composed of numerical and text input. Their id is new_name_of_the_col, we will use this id to match it with the colnames later on.
Again, Shiny should not escape the characters, the other options are just here to improve the render (not search field).
h.How to catch these new fields ?
Now that the fiels are created Shiny need to be able to detect them and use them as an input. As previously, we’ll create a custom shiny input with js:
 tags$script(HTML("$(document).on('click', '#save_changes', function () {
var list_value=[]
for (i = 0; i < $( '.new_input' ).length; i++)
{
list_value.push($( '.new_input' )[i].value)
}
Shiny.onInputChange('newValue', list_value)
});"))
What is the script doing ? When the user click on the action button save_changes, it will collect all the input of class .new_input (the class we set for the new fields) and push them in a list. This list will be assigned to input$newValue .
Input$new_value will hence be observed in Shiny:
 observeEvent(input$newValue,
{
newValue=lapply(input$newValue, function(col) {
if (suppressWarnings(all(!is.na(as.numeric(as.character(col)))))) {
as.numeric(as.character(col))
} else {
col
}
})
DF=data.frame(lapply(newValue, function(x) t(data.frame(x))))
colnames(DF)=colnames(vals$Data)
vals$Data[as.numeric(gsub("modify_","",input$lastClickId))]<-DF

}
)
The first lapply is used to cast the input to the right type (in our case numeric or character). Then, it is put in a data.frame with appropriate colnames. Finally, we can get the proper row to change by using the last modify button the user clicked on.
Here we are, the apps should work perfectly now !
You can find the code HERE.
Thanks for reading the tutorial,
Antoine
You can follow me on Twitter:
Follow @AntGuilllot

R-bloggers.com offers daily e-mail updates about R news and tutorials about learning R and many other topics. Click here if you're looking to post or find an R/data-science job.
Want to share your content on R-bloggers? click here if you have a blog, or here if you don't.