
The making of cricket package yorkr – Part 1
Want to share your content on R-bloggers? click here if you have a blog, or here if you don't.
Introduction
Here is a sneak preview of my latest package cricket package yorkr in R. My earlier package ‘cricketr’ (see Introducing cricketr: An R package for analyzing performances of cricketers) was based on data from ESPN Cricinfo Statsguru. My current package ‘yorkr’ is based on data from Cricsheet. The data for Test, ODI, Twenty20 matches in Cricheet are formatted as yaml files.
While the data available from ESPN Cricinfo Statsguru is a summary of the player’s performances, Cricsheet data is more detailed and granular. Cricsheet gives a ball-by-ball detail for each match as can be seen from the above website. Hence the type of analyses possible can be much more detailed and richer. Some cool functions in this package, include charts for batsman partnerships, performance of batsman against bowlers and how bowlers fared against batsman for a single ODI match or for all ODI matches between 2 opposing sides (for e.g Australia-India or West Indies-Sri Lanka)
This current post includes my first stab at analysing ODI data from Cricsheet. To do this I had to parse the Yaml files and flatten them out as data frames. That was a fairly involved task and I think I now have done it. I then perform analyses on these flattened 1000’s of data frames. This post contains my initial analyses of the ODI data from Cricsheet.
Since the package ‘yorkr’ is still work in progress. I will be adding more functions, refining existing functions and crossing t’s and dotting the i’s. I hope to have the yorkr package wrapped up in about 6-10 weeks time. The package and code should be available after that. Please ‘hold your horses’ till this time.
This report is also available at Rpubs at yorkr-1. The report can also be downloaded as a PDF document at yorkr-1.pdf
The current set of functions developed fall into 4 main categories
- batsmen performance in match
- bowlers performance in match
- batsmen performance against opposition
- bowlers performance against opposition
In the first part of the post I have taken an single Australia-India ODI match on 24 Feb 2008 at Sydney. (For details on this match look up Australia – India, Sydney)
The second part of the past looks at all ODI matches between Australia-India (there are 40 ODI matches between India and Australia)
While this post analyses 1 ODI match and all matches between 2 opposing sides (Australia vs India), the functions developed in yorkr(Part 1) can be used for any of 1000+ ODI matches and any combination of opposing countries!!!
So without much ado let me dive into the functions created
library(dplyr)
library(ggplot2)
library(yorkr)
Get the match details (Aus-Ind,24 Feb 2008,Sydney)
match <- getMatchDetails()
Team batting performances of the opposing teams
In this post I pick a ODI match played between India and Australia on 24 Feb 2008 at Sydney.
1. Team batting details (ODI Match)
This function gives the overall scores of the team for which the function is invoked
Team batting details (ODI Match)
This function gives the overall scores of the team for which the function is invoked
teamBattingDetailsMatch(match,"India")
## Total= 272
## Source: local data frame [11 x 5]
##
##            batsman ballsPlayed fours sixes  runs
##             (fctr)       (int) (dbl) (dbl) (dbl)
## 1         V Sehwag          18     3     0    17
## 2     SR Tendulkar           3     0     0     2
## 3        G Gambhir         118     9     1   113
## 4        RG Sharma           3     0     0     1
## 5     Yuvraj Singh           3     1     0     5
## 6         MS Dhoni          64     4     0    36
## 7       RV Uthappa          40     4     1    51
## 8        IK Pathan          20     2     0    22
## 9  Harbhajan Singh          11     3     0    20
## 10     S Sreesanth           4     0     0     3
## 11        I Sharma           3     0     0     2
teamBattingDetailsMatch(match,"Australia")
## Total= 303
## Source: local data frame [7 x 5]
##
##        batsman ballsPlayed fours sixes  runs
##         (fctr)       (int) (dbl) (dbl) (dbl)
## 1 AC Gilchrist           7     3     0    16
## 2    ML Hayden          61     5     1    54
## 3   RT Ponting         132     7     1   124
## 4    MJ Clarke          38     0     0    31
## 5    A Symonds          48     6     2    59
## 6   MEK Hussey          10     1     0    15
## 7     JR Hopes           3     0     0     4
2. Batsmen partnership (ODI Match)
The plot below shows the partnerships between batsman. Gautham Gambhir scored the highest followed by Uthappa. Gambhir had a good partnership with Sehway, Dhoni and Uthappa. On the Australian side Ponting had a good partnership with Hayden,Clarke and Symonds.
batsmenPartnershipMatch(match,"India")

batsmenPartnershipMatch(match,"Australia")

3. Batsmen vs Bowlers (ODI Match)
This chart shows how each batsman fared against the bowlers. Gambhir scored maximum from Hogg and Clarke. Ponting scores maximum from Pathan, Ishant Sharma, Sreesanth.
batsmenVsBowlersMatch(match,"India")

batsmenVsBowlersMatch(match,"Australia")

4. Team bowling details (ODI Match)
The table gives bowling details of each team
teamBowlingDetailsMatch(match,"India")
## Source: local data frame [6 x 5]
##
##       bowler overs maidens  runs wickets
##       (fctr) (int)   (int) (dbl)   (dbl)
## 1      B Lee    10       2    58       5
## 2 NW Bracken    10       0    53       1
## 3   SR Clark    10       0    55       2
## 4   JR Hopes     6       0    27       1
## 5    GB Hogg     9       0    62       1
## 6  MJ Clarke     5       0    33       0
teamBowlingDetailsMatch(match,"Australia")
## Source: local data frame [6 x 5]
##
##            bowler overs maidens  runs wickets
##            (fctr) (int)   (int) (dbl)   (dbl)
## 1     S Sreesanth     8       0    58       2
## 2        I Sharma    10       0    65       1
## 3       IK Pathan     9       0    73       0
## 4 Harbhajan Singh     9       0    50       2
## 5        V Sehwag     6       0    28       2
## 6    Yuvraj Singh     8       0    38       0
5. Wicket kind (ODI Match)
This chart gives the wicket kind or the type of wicket for the bowler vs the runs scored
teamBowlingWicketKindMatch(match,"India")

teamBowlingWicketKindMatch(match,"Australia")

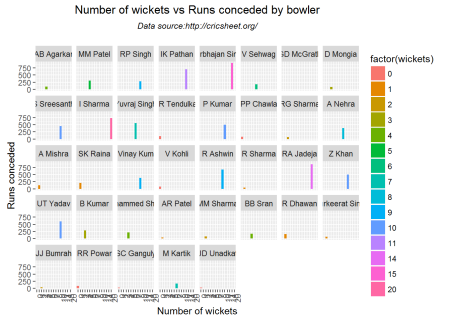
6. Wickets Runs (ODI Match)l
This plot gives the number of wickets taken and the runs conceded by the bowler
teamBowlingWicketRunsMatch(match,"India")

teamBowlingWicketRunsMatch(match,"Australia")

7. Wicket (batsman) and total runs scored (ODI Match)
This plot gives the details of the wickets taken and the runs conceded. Brett Lee has the performance with 5 scalps. On the Indian side Sreesanth, Harbhajan and Sehwag have 2 wickets apiece. Sreesanth is the most expensive,
teamBowlingWicketMatch(match,"India")

teamBowlingWicketMatch(match,"Australia")

8. Bowler vs Batsman (ODI Match)
This plot below shows which of the batsman was most brutal against the bowler or who scored the most against the bowler. Ponting scores most against Pathan.
bowlersVsBatsmanMatch(match,"India")

bowlersVsBatsmanMatch(match,"Australia")

9.
Worm graph (ODI Match) This chart gives the match worm of runs scored against the number deliveries.
matchWormGraph(match,team1="Australia",team2="India")

The following charts show the performances of the batsmen and against the opposition. In this case I have chosen India and Australia. Hence the plots below show the best performers(batsmen and bowlers) of either team against their adversary. The below analyses are based on all ODI confrontations between Australia and India. There are a total of 40 head-on confrontations between Aus-India.
allMatches <- getOppositionDetails()
10.Batsman partnership against opposition (all ODI matches)
The report below gives the batsman who has had the best partnetship in Australia-India matches. On the Indian side the top 3 are Mahendra Singh Dhoni, Rohit Sharma followed by Tendulkar. Ponting, Hussey and Bailey are the top 3 for the Autralians. As far as ODI is concerned Dhoni towers over all others. Of course similar analyses can be done between India-Pakistan, India-South Africa etc. But at least against the Australians we need to have Dhoni and Rohit Sharma I think The report below gives a summary of the partnership runs
report <- batsmanPartnershipOppn(allMatches,"India",report="summary")
report
## Source: local data frame [44 x 2]
##
##         batsman partnershipRuns
##          (fctr)           (dbl)
## 1      MS Dhoni            1156
## 2     RG Sharma             914
## 3  SR Tendulkar             910
## 4       V Kohli             902
## 5     G Gambhir             532
## 6  Yuvraj Singh             524
## 7      SK Raina             509
## 8      S Dhawan             471
## 9      V Sehwag             287
## 10   RV Uthappa             279
## ..          ...             ...
report <- batsmanPartnershipOppn(allMatches,"Australia",report="summary")
report
## Source: local data frame [48 x 2]
##
##       batsman partnershipRuns
##        (fctr)           (dbl)
## 1  RT Ponting             876
## 2  MEK Hussey             753
## 3   GJ Bailey             610
## 4   SR Watson             609
## 5   MJ Clarke             607
## 6   ML Hayden             573
## 7   A Symonds             536
## 8    AJ Finch             525
## 9   SPD Smith             467
## 10  DA Warner             391
## ..        ...             ...
The report below gives a detailed breakup of the partnership runs
report <- batsmanPartnershipOppn(allMatches,"India",report="detailed")
report[1:40,]
##         batsman      nonStriker runs partnershipRuns
## 1      MS Dhoni    SR Tendulkar   71            1156
## 2      MS Dhoni        R Dravid   27            1156
## 3      MS Dhoni    Yuvraj Singh  128            1156
## 4      MS Dhoni        SK Raina  187            1156
## 5      MS Dhoni          M Kaif    6            1156
## 6      MS Dhoni        D Mongia   23            1156
## 7      MS Dhoni Harbhajan Singh   16            1156
## 8      MS Dhoni       IK Pathan   42            1156
## 9      MS Dhoni       G Gambhir  117            1156
## 10     MS Dhoni       RG Sharma   56            1156
## 11     MS Dhoni      RV Uthappa   51            1156
## 12     MS Dhoni     S Sreesanth   19            1156
## 13     MS Dhoni        I Sharma    4            1156
## 14     MS Dhoni         P Kumar    1            1156
## 15     MS Dhoni         V Kohli   78            1156
## 16     MS Dhoni       RA Jadeja  103            1156
## 17     MS Dhoni        R Ashwin   78            1156
## 18     MS Dhoni        R Sharma    2            1156
## 19     MS Dhoni   R Vinay Kumar   30            1156
## 20     MS Dhoni          Z Khan    6            1156
## 21     MS Dhoni       AM Rahane   47            1156
## 22     MS Dhoni       MK Pandey   34            1156
## 23     MS Dhoni Gurkeerat Singh    1            1156
## 24     MS Dhoni         B Kumar   26            1156
## 25     MS Dhoni        RR Powar    3            1156
## 26    RG Sharma    SR Tendulkar   66             914
## 27    RG Sharma    Yuvraj Singh    5             914
## 28    RG Sharma        SK Raina   69             914
## 29    RG Sharma        MS Dhoni   90             914
## 30    RG Sharma               4    0             914
## 31    RG Sharma       G Gambhir   35             914
## 32    RG Sharma         V Kohli  248             914
## 33    RG Sharma       RA Jadeja   13             914
## 34    RG Sharma        R Ashwin   11             914
## 35    RG Sharma        S Dhawan  247             914
## 36    RG Sharma       AM Rahane   77             914
## 37    RG Sharma       MK Pandey   53             914
## 38 SR Tendulkar        R Dravid   12             910
## 39 SR Tendulkar        V Sehwag  111             910
## 40 SR Tendulkar    Yuvraj Singh  173             910
report <- batsmanPartnershipOppn(allMatches,"Australia",report="detailed")
report[1:40,]
##       batsman   nonStriker runs partnershipRuns
## 1  RT Ponting    SR Watson  140             876
## 2  RT Ponting    DR Martyn   35             876
## 3  RT Ponting    MJ Clarke   63             876
## 4  RT Ponting    BJ Haddin   33             876
## 5  RT Ponting    ML Hayden  117             876
## 6  RT Ponting    A Symonds   41             876
## 7  RT Ponting   MEK Hussey   74             876
## 8  RT Ponting AC Gilchrist  113             876
## 9  RT Ponting     TD Paine   68             876
## 10 RT Ponting     CL White   84             876
## 11 RT Ponting    DA Warner    6             876
## 12 RT Ponting      MS Wade    9             876
## 13 RT Ponting    DJ Hussey   20             876
## 14 RT Ponting     SE Marsh   45             876
## 15 RT Ponting     BJ Hodge   28             876
## 16 MEK Hussey   RT Ponting   85             753
## 17 MEK Hussey    MJ Clarke   74             753
## 18 MEK Hussey    BJ Haddin   24             753
## 19 MEK Hussey      GB Hogg   19             753
## 20 MEK Hussey   MG Johnson   43             753
## 21 MEK Hussey     SR Clark    4             753
## 22 MEK Hussey    ML Hayden    5             753
## 23 MEK Hussey    A Symonds    5             753
## 24 MEK Hussey        B Lee   39             753
## 25 MEK Hussey   NW Bracken    3             753
## 26 MEK Hussey     JR Hopes   83             753
## 27 MEK Hussey     CL White  185             753
## 28 MEK Hussey    DA Warner   10             753
## 29 MEK Hussey      MS Wade   35             753
## 30 MEK Hussey    DJ Hussey   10             753
## 31 MEK Hussey   PJ Forrest   59             753
## 32 MEK Hussey     AC Voges   59             753
## 33 MEK Hussey MC Henriques   11             753
## 34  GJ Bailey    SR Watson   79             610
## 35  GJ Bailey    BJ Haddin    7             610
## 36  GJ Bailey            4    0             610
## 37  GJ Bailey    DA Warner    6             610
## 38  GJ Bailey     AJ Finch   22             610
## 39  GJ Bailey    SPD Smith  149             610
## 40  GJ Bailey   GJ Maxwell  133             610
11. Partnership runs against opposition (all ODI matches)
The chart below gives the overall partnership. It is graphical representation of the chart above.
batsmanPartnershipOppnChart(allMatches,"India")

batsmanPartnershipOppnChart(allMatches,"Australia")

12. Batsmen vs Bowlers against opposition (all ODI matches)
The chart below gives how the batsmen fared against the bowlers of the opposition.
batsmanVsBowlersOppn(allMatches,"India")

batsmanVsBowlersOppn(allMatches,"Australia")

13. Team batting details opposition (all ODI matches)
The table below gives the total runs scores by each batsman and is dsiplayed in descending order. Dhoni, Rohit Sharma and Tendulkar are the top 3 for India and Ponting, Hussey and Bailey lead for Australia
teamBattingDetailsOppn(allMatches,"India")
## Total= 8313
## Source: local data frame [44 x 5]
##
##         batsman  runs fours sixes ballsPlayed
##          (fctr) (dbl) (int) (int)       (int)
## 1      MS Dhoni  1156    78    22        1406
## 2     RG Sharma   914    72    24        1015
## 3  SR Tendulkar   910   103     6        1157
## 4       V Kohli   902    87     6         961
## 5     G Gambhir   532    43     2         677
## 6  Yuvraj Singh   524    52    11         664
## 7      SK Raina   509    43    11         536
## 8      S Dhawan   471    55     6         470
## 9      V Sehwag   287    42     4         303
## 10   RV Uthappa   279    28     7         295
## ..          ...   ...   ...   ...         ...
teamBattingDetailsOppn(allMatches,"Australia")
## Total= 9993
## Source: local data frame [48 x 5]
##
##       batsman  runs fours sixes ballsPlayed
##        (fctr) (dbl) (int) (int)       (int)
## 1  RT Ponting   876    86     8        1107
## 2  MEK Hussey   753    56     5         816
## 3   GJ Bailey   610    50    13         578
## 4   SR Watson   609    81    10         653
## 5   MJ Clarke   607    45     5         786
## 6   ML Hayden   573    72     8         660
## 7   A Symonds   536    43    15         543
## 8    AJ Finch   525    52     9         617
## 9   SPD Smith   467    44     7         431
## 10  DA Warner   391    40     6         385
## ..        ...   ...   ...   ...         ...
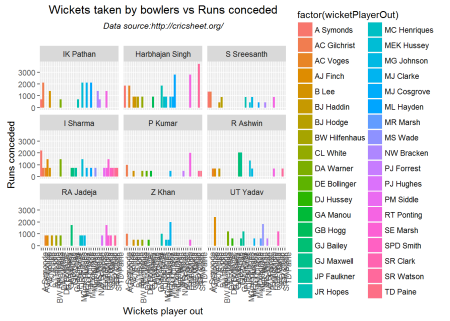
14. Bowler vs Batsman against opposition (all ODI matches)
The charts below give the performance of the bowlers against batsman
bowlersVsBatsmanOppn(allMatches,"India")

bowlersVsBatsmanOppn(allMatches,"Australia")

15. Bowling details against opposition (all ODI matches)
For matches between Australia and India the top 3 wicket takes for Australia are Mitchell Johnson, Brett Lee and JR Faulkner. For India it is Ishant Sharma, Harbhajan Singh and R A Jadeja.
teamBowlingDetailsOppn(allMatches,"India")
## Source: local data frame [39 x 5]
##
##          bowler overs maidens  runs wickets
##          (fctr) (int)   (int) (dbl)   (dbl)
## 1    MG Johnson    40       0  1012      18
## 2         B Lee    21       1   667      15
## 3   JP Faulkner    33       0   598      13
## 4     SR Watson    24       0   532      12
## 5       GB Hogg    15       0   427      12
## 6      CJ McKay    17       0   403      12
## 7    NW Bracken    28       2   429      11
## 8      MA Starc    12       2   251      11
## 9      JR Hopes    18       0   346       8
## 10 DE Bollinger    11       4   174       8
## ..          ...   ...     ...   ...     ...
teamBowlingDetailsOppn(allMatches,"Australia")
## Source: local data frame [37 x 5]
##
##             bowler overs maidens  runs wickets
##             (fctr) (int)   (int) (dbl)   (dbl)
## 1         I Sharma    44       1   739      20
## 2  Harbhajan Singh    40       0   926      15
## 3        RA Jadeja    39       0   867      14
## 4        IK Pathan    42       1   702      11
## 5         UT Yadav    37       2   606      10
## 6          P Kumar    27       0   501      10
## 7           Z Khan    33       1   500      10
## 8      S Sreesanth    34       0   454      10
## 9         R Ashwin    43       0   680       9
## 10   R Vinay Kumar    31       1   380       9
## ..             ...   ...     ...   ...     ...
16. Wicket kind against opposition (all ODI matches)
These charts give the wicket kind for each of the top 9 bowlers from each side.
teamBowlingWicketKindOppn(allMatches,"India")

teamBowlingWicketKindOppn(allMatches,"Australia")

17. Wicket runs against opposition (all ODI matches)
These given the runs conceded by the bowlers
teamBowlingWicketRunsOppn(allMatches,"India")

teamBowlingWicketRunsOppn(allMatches,"Australia")
18. Wickets against opposition (all ODI matches)
The charts below depict the wickets taken by each bowler. If you notice Mitchel Johnson has the most wickets.
teamBowlingWicketsOppn(allMatches,"India")

teamBowlingWicketsOppn(allMatches,"Australia")
Conclusion :
Some key findings
In the ODI confrontations between Australia and India the top 3 batsmen of India are
- Mahendra Dhoni 2.Rohit Sharma
- Sachin Tendulkar.
The best bowlers for India are
- Ishant Sharma
- Harbhajan Singh
- R A Jadeja
For the Australian side the top 3 batsmen are
- R A Ponting
- M Hussey
- G J Bailey
The top 3 bowlers are
1. Mitchell Johnson
2. Brett Lee
3. J P Faulkner
Note: This is the first part of my yorkr package. I will be adding more functions in the weeks to come. Clearly the data from Cricsheet is more granular and allows for more detailed analyses. I should have the next set of functions soon.
Watch this space!!!
Also see
- Cricket analytics with cricketr
- Introducing cricketr! : An R package to analyze performances of cricketers
- Sixer – R package cricketr’s new Shiny avatar
- Informed choices through Machine Learning – Analyzing Kohli, Tendulkar and Dravid
You may also like
- Natural language processing: What would Shakespeare say?
- Revisiting crimes against women in India
- Literacy in India – A deepR dive
- TWS-4: Gossip protocol: Epidemics and rumors to the rescue
- Singularity
- Simulating an Edge shape in Android
- Programming Zen and now – Sime essential tips
- Rock N’ Roll with Bluemix, Cloudant & NodeExpress
- Architecting a cloud based IP Multimedia System (IMS)

R-bloggers.com offers daily e-mail updates about R news and tutorials about learning R and many other topics. Click here if you're looking to post or find an R/data-science job.
Want to share your content on R-bloggers? click here if you have a blog, or here if you don't.