
R plotmath functions combined with variable values
Want to share your content on R-bloggers? click here if you have a blog, or here if you don't.
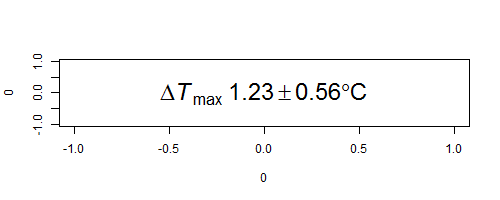
Getting certain special symbols into R plots, combined with values that are currently stored in variables, has been an ongoing headache of mine. In particular, plotmath symbols such as the plus-minus sign (±), for which the plotmath command is %+-%, had always caused problems due to my inability to parse the R help documentation. For an example, I was trying to get the following simple value (a mean ± 1 SE for a temperature difference) inserted into a plot (a minimalist example):
It turns out that the plotmath operators that are surrounded by percent signs need to be surrounded by empty quote marks to get them to appear correctly inside a bquote() call. To make the plot above, I used the following commands:
# Define some variables
mymean = 1.2345678
mySE = 0.55555
# Make the empty plot
plot(x = 0, y = 0, type = 'n')
# Assemble a label, using bquote()
mylabel = bquote(Delta*italic(T)[max]~.(format(mymean,digits=3))*''%+-%''*
				.(format(mySE,digits=2))*degree*C)
# Add mylabel to the plot at x=0, y=0
text(x = 0, y = 0, labels = mylabel, font = 2, cex = 2)
The bquote() is where the action happens. Inside bquote(), I have the following arguments:
-
Deltagets interpreted as a keyword, and turned in to the greek symbol. - The asterisk makes sure Delta is directly next to whatever follows the asterisk (instead of the ~ tilde symbol, which inserts a blank space).
-
italic(T)makes the capital letter T appear in italics. -
[max]makes whatever is inside the brackets into a subscript. A superscript would be set using the ^ symbol. - The tilde puts a space after the subscript
-
.(format(mymean,dig=3))evaluates the variable inside.()and returns the value. In this case, I have inserted a call toformat()to make sure the value ofmymeanis displayed with a sensible number of significant digits. - The asterisk leads into the
''%+-%''chunk. The empty quotes around%+-%allow it to work here and be converted into the ± symbol. - The next asterisk leads into
.(format(mySE,digits=2)), which is another call to.()used to retrieve and print the numeric value stored inmySE, with the appropriate number of digits. - The next asterisk leads into
degree, which is another keyword, and R will convert it into the degree symbol °. - Finally, the next asterisk leads to
C, which just gets interpreted as the letter C, since it is not a keyword. I could have written a whole word here if desired (Celsius), or even multiple words separated by ~ tildes.
Once mylabel is assembled, I stick it in the plot at a location defined in the text() function.
The complete list of keywords and operator symbols available for use in this way can be found by typing ?plotmath at the R console and perusing the help file.
R-bloggers.com offers daily e-mail updates about R news and tutorials about learning R and many other topics. Click here if you're looking to post or find an R/data-science job.
Want to share your content on R-bloggers? click here if you have a blog, or here if you don't.