
Plotting non-overlapping circles…
[This article was first published on gRaphics!, and kindly contributed to R-bloggers]. (You can report issue about the content on this page here)
Want to share your content on R-bloggers? click here if you have a blog, or here if you don't.
It’s holiday today in Sweden, so happy Midsummer to everyone!!! (I know, it’s delayed)Want to share your content on R-bloggers? click here if you have a blog, or here if you don't.
No work for me, so I checked up the latest XKCD:
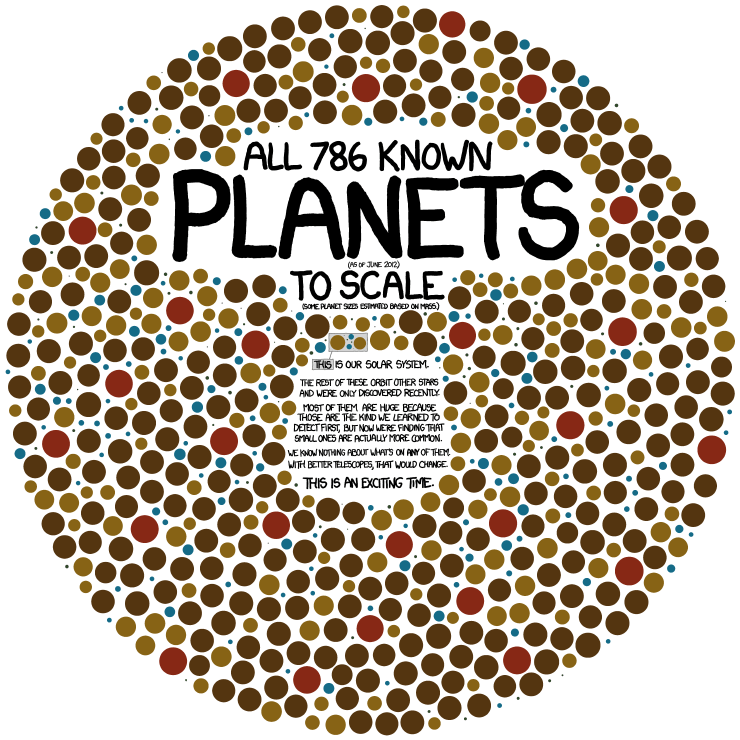
Gorgeous, right? So I decided to see if I could make something similar – but being lazy, I didn’t feel like drawing all circles one by one… I decided to try and have R do it for me instead.
The trick is in drawing the n-th circle avoiding to plot over the previous (n-1). The rest is eye-candy.
So, first of all, you need a data set: you can get the original one from (I presume) exoplanets.eu, if you like. At first I tried but then I just decided to use a randomly generated set:
N<-650 # number of exoplanetsI redorder the exoplanets in order of mass, so that they’ll be printed from the largest to the samllest… it makes it easier later on to generate the plot, a bit like it’s easier filling a bucket with rocks, then with gravel, then with sand, than doing it the other way around…
R<-1000 # radius of a 2D-circle where you'll want to plot them
MinMass<-5; # minimum mass for the planets
MaxMass<-100; # maximum mass for the planets
P<-6 # power exponent for the mass distribution
Q<-3 # this exponent scales the mass to radii...
margin<-mean(c(MinMass,MaxMass)); # a minimum separation you want to mantain between planets when plotted
# a function to name each planet with a random string of letters (optional)
getRandString<-function(len=8) return(paste(sample(c(LETTERS,letters),len,replace=TRUE),collapse=''))
exoplanets<-list(Mass=sort(runif(N, MinMass^(1/P), MaxMass^(1/P))^P, decreasing=TRUE), Name=replicate(n=N, getRandString()))
Ok, so now we have a bunch of data which looks like this:
> exoplanets$Name[1:5]
[1] “lRnrqjcQ” “YuhcqSTO” “MmrAZvzi” “ROMpQwlZ” “epnBwmtj”
> exoplanets$Mass[1:5]
[1] 99.98406 99.43530 99.26070 98.80203 98.50710
next we define a matrix where to store the x and y values needed for plotting, together with a function to generate those values:
mtrx<-matrix(nrow=N, ncol=2); colnames(mtrx)<-c('x','y')
getxy_withinR<-function(R=10) {
r<-runif(1,0,R^2)^(1/2); theta<-runif(1,0,2*pi);
x<-r*cos(theta)
y<-r*sin(theta)
return(c(x,y))
}
as some of you may have spotted, the x/y values are generated within circle of a given radius, at an angle theta randomly chosen. Importantly, in order not to crowd the origin, I apply a 1/r^2 scaling to the coordinates being generated…
Now it’s time to set up a function to check if a bubble is bumping on any other:
check_bounce <- function(x,y,rad,X,Y,RAD) {
distance<-sqrt((X-x)^2 + (Y-y)^2); # print (paste("distance is ",distance))
radsum<-RAD^(1/Q)+rad^(1/Q)+margin; # print(paste("radius sum is ",radsum))
return(sum(distance < radsum))
}
I just compute the distance from another (set of) bubble(s)… The function will soon be applied but first let’s draw an empty plot:
lim<-R+MaxMass
plot(NULL, xlim=c(-lim,lim), ylim=c(-lim,lim))
Now it’s the time to loop over all bubbles to generate the coordinates, check if they bump with others, and draw them in many colors…
for (n in 1:N) {
print(paste(“placing”,n, exoplanets$Name[n]))
# generate new coordinates
xy<-getxy_withinR(R); x<-xy[1]; y<-xy[2];
if (n!=1) {
tocheck<-(1:(n-1))
while(overlap<-check_bounce(x,y,exoplanets$Mass[n],mtrx[tocheck,'x'],mtrx[tocheck,'y'],exoplanets$Mass[tocheck]) > 0)
{
xy<-getxy_withinR(R); x<-xy[1]; y<-xy[2];
}
}
mtrx[n,’x’]<-x; mtrx[n,’y’]<-y;
# draw a circle once you know where
exoplanets$X[n]<-xy[1]; exoplanets$Y[n]<-xy[2];
draw.circle(x=exoplanets$X[n], y=exoplanets$Y[n], r=exoplanets$Mass[n]^(2/Q), col=rgb(runif(1,0,1),runif(1,0,1),runif(1,0,1),(0.5+n/(2*N))), border=rgb(runif(1,0,1),runif(1,0,1),runif(1,0,1),(0.5+n/(2*N))))
# Sys.sleep(0.03)
}
I draw the large ones first, and I keep them semi-transparent, decreasing the transparency as I go forward, in the hope that this will make it easier to spot new bubbles appearing when the plot is crowded… Judge yourself if it works:

I know, it doesn’t really look like Randall’s drawing at XKCD – it’s tricky to compactify all the bubbles without overlapping them… and the dumb algo I came up with to check bumps doesn’t scale very well…
I’ve toyed with the idea of making the bubbles into a dynamic system with some attraction and repulsion, letting it evolve to an equilibrium state… But I didn’t want to get too bogged down with it… perhaps later…
For the moment, it’s close enough. It’s sunny outside and I deserve some cycling time. Source code is below:
Never mind my dumb attempt – here’s a better solution in a blog post I wasn’t aware of: http://www.r-bloggers.com/circle-packing-with-r/
To leave a comment for the author, please follow the link and comment on their blog: gRaphics!.
R-bloggers.com offers daily e-mail updates about R news and tutorials about learning R and many other topics. Click here if you're looking to post or find an R/data-science job.
Want to share your content on R-bloggers? click here if you have a blog, or here if you don't.