
Outlier App: An Interactive Visualization of Outlier Algorithms
Want to share your content on R-bloggers? click here if you have a blog, or here if you don't.
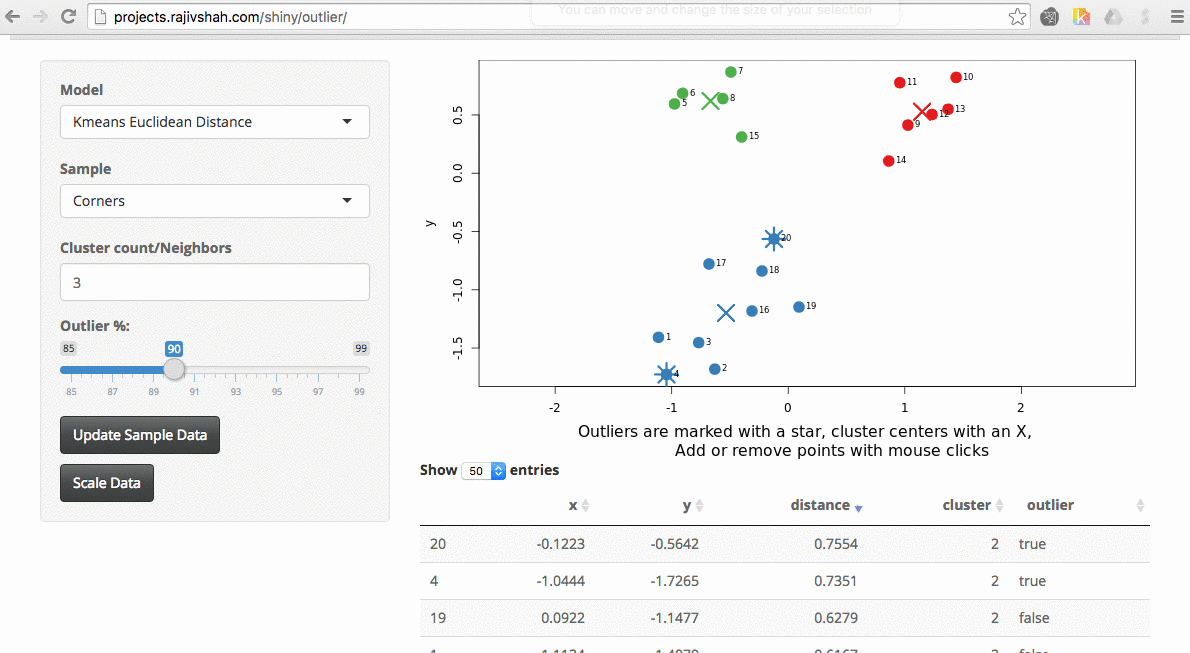
I was recently trying various outlier detection algorithms. For me, the best way to understand an algorithm is to tinker with it. I built a shiny app that allows you to play around with various outlier algorithms and wanted to share it with everyone.
The shiny app is available on my site, but even better, the code is on github for you to run locally or improve! Let me give you a quick tour of the app in this post. If you prefer, I have also posted a video that provides background on the app. Another tutorial how to build a interactive web apps with shiny is published at DataScience+.
Background
The available algorithms include:
– Hierarchical Clustering (DMwR)
– Kmeans Euclidean Distance
– Kmeans Mahalanobis
– Kmeans Manhattan
– Fuzzy kmeans – Gustafson and Kessel
– Fuzzy k-medoids
– Fuzzy k-means with polynomial fuzzifier
– Local Outlier Factor (dbscan)
– RandomForest (proximity from randomForest)
– Isolation Forest (IsolationForest)
– Autoencoder (Autoencoder)
– FBOD and SOD (HighDimOut)

There are also a wide range of datasets to try as well. They include randomly scattered points, defined clusters, and some more unusual patterns like the smiley face and spirals. Additionally, you can use your mouse to add and/or remove points by clicking directly within the visualization. This allows you to create your own dataset.

Using the app
Once the data is loaded, you can start exploring. One thing you can do is look at the effect scaling can have. In this example, you can see how outliers differ when scaling is used with kmeans. The values on the far right no longer dominate the distance measurements, and there are now outliers from other areas:

It quickly becomes apparent that different algorithms may select different outliers. In this case, you see a difference between the outliers selected using an autoencoder versus isolation forest.

Another example here is the difference between chosen outliers using kmeans versus fuzzy kmeans:
A density based algorithm can also select different outliers versus a distance based algorithm. This example nicely shows the difference between kmeans and lof (local outlier factor from dbscan)

An important part of using this visualization is studying the distance numbers that are calculated. Are these numbers meshing with your intuition? How big of a quantitative difference is there between outliers and other points?

3D+ App?
The next thing is whether to expand this to larger datasets. This is something that you would run locally (large datasets take too long to run for my shiny server). The downside of larger datasets is that it gets tricker to visualize them. For now, I am using a TSNE plot. I am open to suggestions, but the intent here is a way to evaluate outlier algorithms on a variety of datasets.

Source Code
The source code for the outlier app is on github. The app is built off a variety of R packages and could easily be extended to new packages or incorporate additional datasets. Please send me bug fixes, additional algorithms, tighter code, or ideas for improving the app.
Related Post
- Creating an animation using R
- The importance of Data Visualization
- ggplot2 themes examples
- Map the Life Expectancy in United States with data from Wikipedia
- What can we learn from the statistics of the EURO 2016 – Application of factor analysis
R-bloggers.com offers daily e-mail updates about R news and tutorials about learning R and many other topics. Click here if you're looking to post or find an R/data-science job.
Want to share your content on R-bloggers? click here if you have a blog, or here if you don't.