
24 Days of R: Day 24
Want to share your content on R-bloggers? click here if you have a blog, or here if you don't.
OK, so I phoned it in last night. Final post and maybe this one will be a bit better. Can't recall what got me thinking about it, but I was running over the issue of school performance and the erroneous notion that small class sizes will produce better students. This is occasionally debunked, but I thought it'd be fun to demonstrate the appeal of this notion through a random simulation. If memory serves, this is somewhat similar to something that Markus Gesman wrote about on his blog earlier this year.
I'll construct a set of 100 classes, each of which has a random number of students. Each student will have the same probability distribution that describes their performance on an exam. In each case, I'll use a normal distribution, but will round the results so that I get only integral values. I'll also ensure that I only have positive values.
IntegralNormal = function(n, mean, sd, min, max) {
    val = rnorm(n, mean = mean, sd = sd)
    val = round(val)
    val = pmin(val, max)
    val = pmax(val, min)
    val
}

set.seed(1234)
numClasses = 100
numStudents = IntegralNormal(numClasses, 20, 3, 10, 30)
dfClass = data.frame(ClassID = 1:numClasses, NumStudents = numStudents)

CreateStudentResults = function(x, mean, sd, min, max) {
    numStudents = x$NumStudents
    ClassID = x$ClassID
    Score = IntegralNormal(numStudents, mean, sd, min, max)
    df = data.frame(ClassID = rep(ClassID, numStudents), Student = 1:numStudents,
        Score = Score)
    df
}

library(plyr)
dfTestResults = ddply(dfClass, .(ClassID), CreateStudentResults, mean = 70,
    sd = 10, min = 0, max = 100)
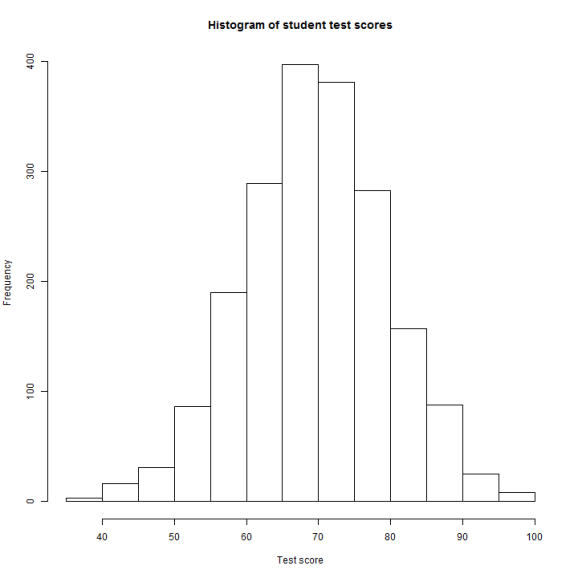
So how did the students do? Looks like they average about a C, with some extraordinary performers at either end.
hist(dfTestResults$Score, xlab = "Test score", main = "Histogram of student test scores")
I'm sure that any administrator would like to know which classrooms managed to produce the best overall results.
dfClassResults = ddply(dfTestResults, .(ClassID), summarize, AverageScore = mean(Score))
dfClassResults = merge(dfClassResults, dfClass)
dfClassResults = dfClassResults[order(dfClassResults$AverageScore, decreasing = TRUE),
    ]
sum(dfClassResults$NumStudents[1:25] < 20)

## [1] 15
Amazing! 60% of classes in the top quartile had a class size which was below average. Class size is clearly a strong indicator of student performance. But perhaps this was just a fluke. What happens in the following year?
dfTestResultsTwo = ddply(dfClass, .(ClassID), CreateStudentResults, mean = 70,
    sd = 10, min = 0, max = 100)
dfClassResultsTwo = ddply(dfTestResultsTwo, .(ClassID), summarize, AverageScore2 = mean(Score))
dfClassResults = merge(dfClassResults, dfClassResultsTwo)
dfClassResults = dfClassResults[order(dfClassResults$AverageScore2, decreasing = TRUE),
    ]
sum(dfClassResults$NumStudents[1:25] < 20)

## [1] 14

sum(dfClassResults$NumStudents[1:10] < 20)

## [1] 8
Similar results in the second year! In fact, 8 out of the top 10 schools have class sizes below average. Well, that proves it.
Anyone who's reading this blog knows that it doesn't prove anything. I've cherry picked the data, I've not observed the results in the same class from the first to the second year, I've not looked at any other variables which may cause these results and I've not constructed and vetted any model to explain the results.
fit = lm(AverageScore ~ 1 + NumStudents, data = dfClassResults)
summary(fit)

##
## Call:
## lm(formula = AverageScore ~ 1 + NumStudents, data = dfClassResults)
##
## Residuals:
##    Min     1Q Median     3Q    Max
## -4.276 -1.379 -0.163  1.078  4.240
##
## Coefficients:
##             Estimate Std. Error t value Pr(>|t|)
## (Intercept)  69.1965     1.3097    52.8   <2e-16 ***
## NumStudents   0.0401     0.0663     0.6     0.55
## ---
## Signif. codes:  0 '***' 0.001 '**' 0.01 '*' 0.05 '.' 0.1 ' ' 1
##
## Residual standard error: 1.99 on 98 degrees of freedom
## Multiple R-squared:  0.00372,    Adjusted R-squared:  -0.00645
## F-statistic: 0.366 on 1 and 98 DF,  p-value: 0.547
The number of students is- as we would expect- not a meaningful predictor of test scores. I'll emphasize the obvious point that this is an artificial example and does not demonstrate that smaller class sizes have impact on student performance. This is merely demonstrates that if there were no impact, we could find one. Smaller samples have greater volatility and will appear as outliers on either end of the spectrum.
And that does it. 24 days. 24 posts about R. Later, I'll ruminate on what the exercise meant. For now, thanks to folks who have read and responded. I had a lot of fun doing this and hope that it was- at a minimum- a pleasant diversion.
sessionInfo

## function (package = NULL)
## {
##     z <- list()
##     z$R.version <- R.Version()
##     z$platform <- z$R.version$platform
##     if (nzchar(.Platform$r_arch))
##         z$platform <- paste(z$platform, .Platform$r_arch, sep = "/")
##     z$platform <- paste0(z$platform, " (", 8 * .Machine$sizeof.pointer,
##         "-bit)")
##     z$locale <- Sys.getlocale()
##     if (is.null(package)) {
##         package <- grep("^package:", search(), value = TRUE)
##         keep <- sapply(package, function(x) x == "package:base" ||
##             !is.null(attr(as.environment(x), "path")))
##         package <- sub("^package:", "", package[keep])
##     }
##     pkgDesc <- lapply(package, packageDescription, encoding = NA)
##     if (length(package) == 0)
##         stop("no valid packages were specified")
##     basePkgs <- sapply(pkgDesc, function(x) !is.null(x$Priority) &&
##         x$Priority == "base")
##     z$basePkgs <- package[basePkgs]
##     if (any(!basePkgs)) {
##         z$otherPkgs <- pkgDesc[!basePkgs]
##         names(z$otherPkgs) <- package[!basePkgs]
##     }
##     loadedOnly <- loadedNamespaces()
##     loadedOnly <- loadedOnly[!(loadedOnly %in% package)]
##     if (length(loadedOnly)) {
##         names(loadedOnly) <- loadedOnly
##         pkgDesc <- c(pkgDesc, lapply(loadedOnly, packageDescription))
##         z$loadedOnly <- pkgDesc[loadedOnly]
##     }
##     class(z) <- "sessionInfo"
##     z
## }
## <bytecode: 0x0000000010f44640>
## <environment: namespace:utils>

R-bloggers.com offers daily e-mail updates about R news and tutorials about learning R and many other topics. Click here if you're looking to post or find an R/data-science job.
Want to share your content on R-bloggers? click here if you have a blog, or here if you don't.