
How Many Data Scientists Are There?
[This article was first published on R, Ruby, and Finance, and kindly contributed to R-bloggers]. (You can report issue about the content on this page here)
Want to share your content on R-bloggers? click here if you have a blog, or here if you don't.
Want to share your content on R-bloggers? click here if you have a blog, or here if you don't.
I’ve seen a lot of articles lately about “Big Data” and the looming “talent gap.” This article from the Wall Street Journal is a good example. It cites a McKinsey estimate that states that we will need 1.5 million more managers and analysts who are conversant with “big data.” Of course, some of this is the media latching on the the next “big thing” (data), but some of it is true. Even anecdotal evidence, such as the number of job postings you find when you search for “data science,” indicates that there is a significant unmet demand for data analysis skills.
This led me to wonder how we could quantify this gap, and once we figure out how to quantify it, if we can figure out if there has been a commensurate increase in the number of people with the skills to work with big data.
This is interesting from the perspective of someone who works with data simply because I want to know the state of the field. I am a pretty recent entrant into the area, and I would like to see more people get into it.
Potential Ways to Quantify Data Analysis Supply and Demand
There are a few different ways we can go in terms of this.- We can use Google Search trends to find the trend for the term “big data.”
-Pros: Easy. Look, I already did it.
-Cons: Trivial, doesn’t really give us a way to disambiguate supply (number of data scientists) and demand (companies looking for analytical skills). - We can crawl job websites looking for jobs that mention data in some way.
-Pros: Probably a pretty comprehensive way to look at the “demand” side of the equation. We can use number of days a job posting is up as a proxy for supply.
-Cons: Our proxy for supply will be pretty noisy because some job listings stay up forever, and when they are taken down doesn’t necessarily correlate with when they are filled. Also, this will give us very unstructured data, and will be very dependent on which job sites we crawl. - We can look at Kaggle.com, which is a website that hosts data science competitions, to see how many people enter each competition, and how that count changes over time.
-Pros: Relatively structured data (competitor count). Gives us a window into both sides of the market (supply is number of competitors, demand is number of companies hosting competitions).
-Cons: Not all companies have heard of Kaggle, and not all people who work with data have heard of Kaggle. The numbers will be biased because competitor count is dependent on two things: people hearing about Kaggle, and people being interested in/having the skills to work with data. We are only really interested in the second part, but it will be affected by the first part.
-It is simpler than creating a crawler, and much less trivial than relying on Google Trends.
-I am familiar with the platform.
-While the competitor count is dependent to some extent on who has heard of Kaggle, I think that it is fair to say that as of a few months ago, most people who work with data had heard of Kaggle in some form (this is strictly anecdotal, though).
Defining and Solving the Problem
So now, we still want to look at the supply of data scientists, and the demand for data scientists, but we want to do it within the context of Kaggle.com.If you are unfamiliar with Kaggle, it is a crowdsourcing platform that allows companies to host competitions on various aspects of their data. For example, one company wanted individuals to predict bond prices in the future. Competitors register for these competitions, and are ultimately awarded prize money based on their final position in the standings.
So, this gives us an easy way to define supply and demand. Supply can be defined as the number of competitors that are actively engaged in the Kaggle platform at any one time. As each competition has an end date, a competitor will only be counted as “active” if he or she has an entry in a competition that has not ended yet.
Demand can simply be counted as the number of competitions that are currently active. This is a bit tricky, because it seems that demand for the Kaggle platform from the company side might be increasing faster than the overall demand for Big Data (given that Kaggle is relatively new and it takes time for word to circulate).
Now, to define our procedure:
Each Kaggle competition has a leaderboard associated with it. The leaderboard lists all active participants, along with their rank in the competition. Additionally, Kaggle allows for old leaderboards to be seen.
Because we can see the leaderboard at various points in time, we can easily figure out how many active participants each competition had at any given time point. Adding the unique users for each active competition will give us a count of active users at that time point. If we do this for multiple time points across all competitions, we can figure out how the number of active users changed over time.
Active Participants by Competition
This leads us to a (fairly messy) chart that shows how each competition gained active participants over time. As data was only scraped on a weekly basis, the figures might not be 100% accurate in terms of competition start times. Once the number of competitors line becomes flat, it indicates that the competition is closed. Generally, competitions that are higher up in the legend are more recent.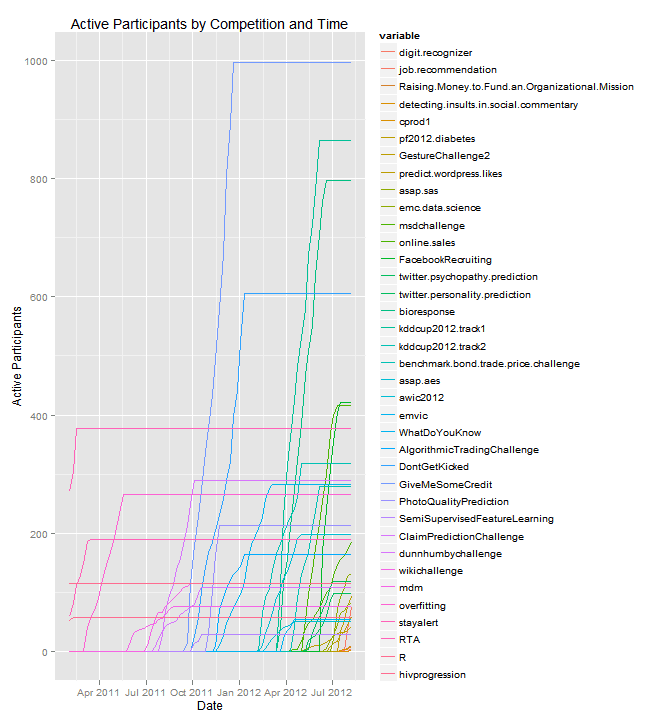
Active Participants Overall
Now, we can aggregate the numbers, and look at unique active users across all competitions. So if “Bob” is active in competition A and competition B at the same time, he is only counted once.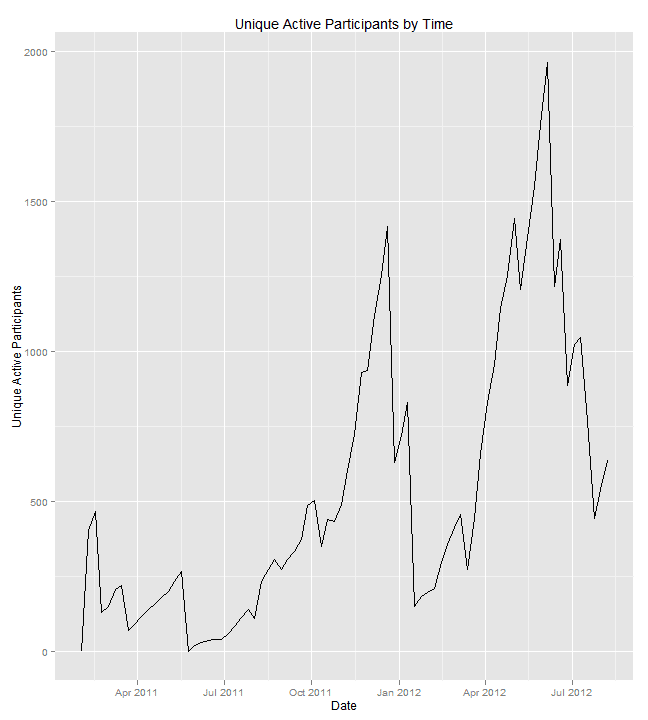
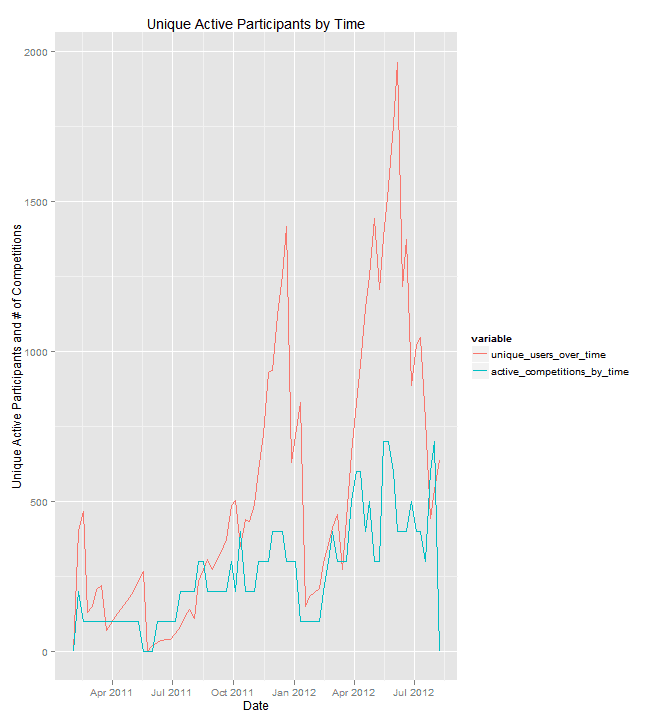
We can fit a linear model to the data and figure out what the expected number of users based solely on the number of active competitions should be.
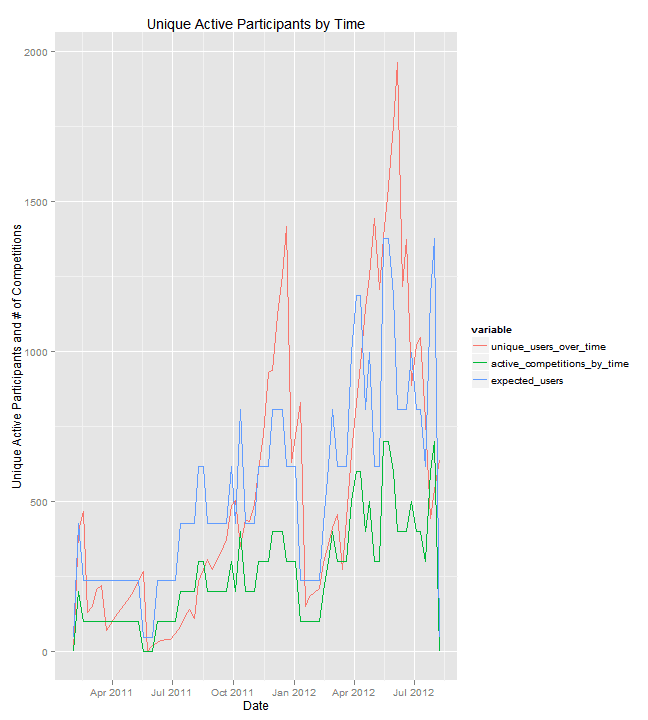
We can see that they are pretty well correlated. Most of the variation in the number of users seems to be explained by the number of competitions, although we do see that when competitions are close to ending, there appears to be large rush of participants. Also, very recently (the month of July), we see that the actual number of unique active users is far below the expected number (ignore the very end of the chart, where all numbers drop to zero).
How Quickly Competitions Attract Participants
Another way to look at the supply of data scientists versus demand is to see if more recent competitions (that have come about in a time when there are more active competitions overall) gain participants more slowly or more quickly than previous competitions.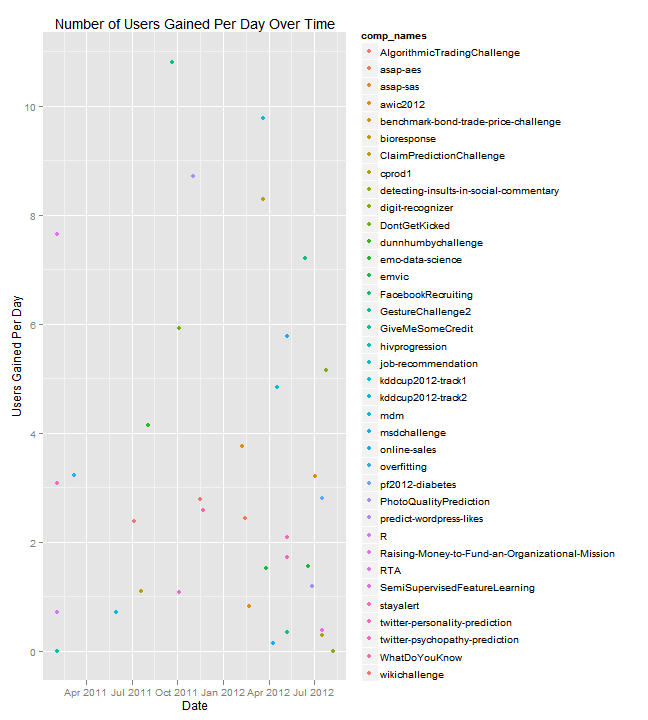
This plot shows us how many users per day each competition attracts, and how that has changed over time. Although it may look like there is a trend in this plot (particularly towards the very end, when slopes are small), there is no significant correlation between date of competition launch and number of users gained per day.
Total Participants Over Time
In previous charts, we looked at unique active users or unique participants over time. We can also look at aggregate number of unique users over time–the total number of unique individuals who have submitted an entry to any Kaggle competition. This shows us how the platform is growing.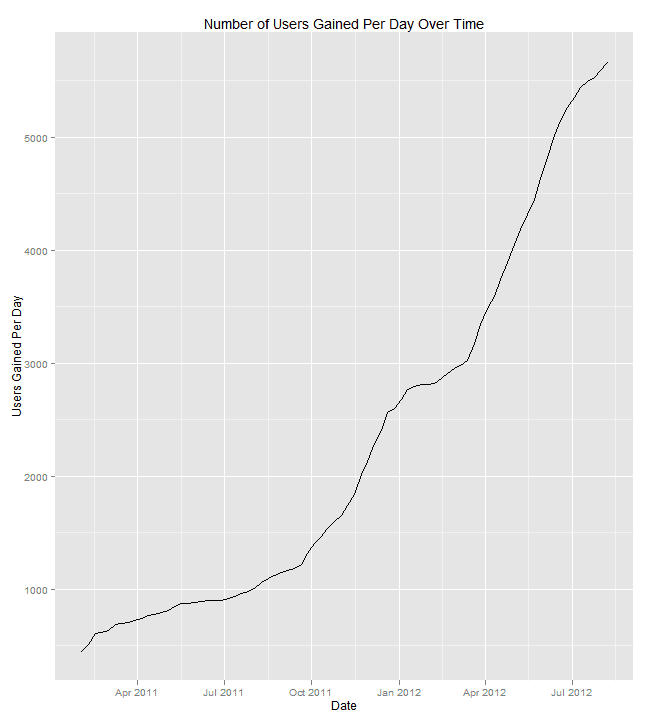
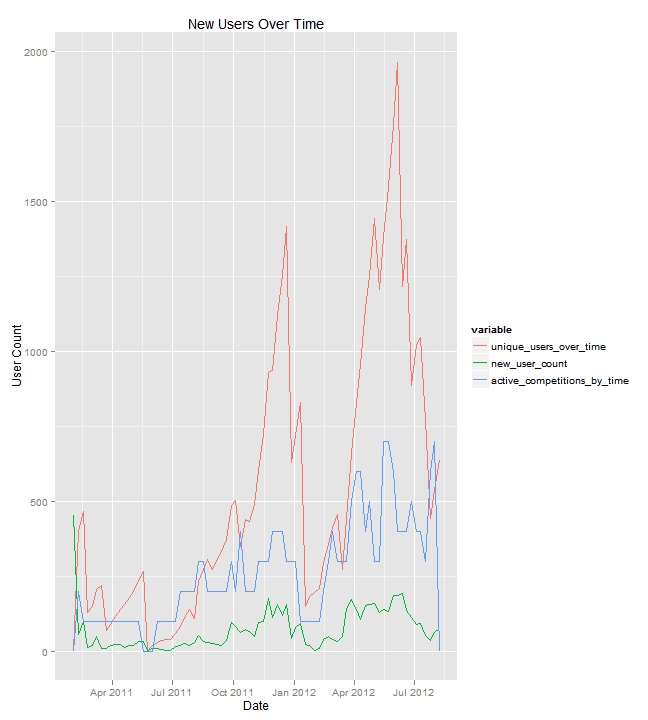
New Users Over Time
We can figure out new users at each weekly time period (users who have submitted entries in the week who did not submit any previous entries).Graphing this allows us to see how the community is growing and expanding.
Some Random Observations
Okay, so we have some data and some (maybe) pretty pictures, but what does it tell us? We can gain some insight from this.- There are clearly some competitions that are favored strongly over others. As someone who has participated in a lot of Kaggle competitions, I can safely say that these are competitions that have an interesting premise, the potential for an interesting opportunity (KDD Cup/Facebook Recruiting), or have data that is easy to work with in terms of format and presentation (Bio response).
- It seems like the average number of competitors per competition has been pretty constant, even as Kaggle has ramped up their number of concurrent competitions. Some recent competitions have not seen much uptake, but that could be the combination of several relatively insignificant factors (summer, uninteresting competitions, etc), rather than signalling that we have reached capacity.
- As we can see by the number of people who have submitted an entry overall vs the number of people who are active at any given time, there is a large data science community that only uses Kaggle when they see something interesting. As fresh people begin to compete, it seems that older users stop using the platform, whether it be from boredom, lack of time, or another issue. This keeps the number of active unique users much more constant (slow growth) than the aggregate number of users.
This points to there being constant new entrants into the data science world, at least within the context of Kaggle, but it is hard to figure out if these entrants are new to data science entirely, or simply new to the Kaggle platform. The Kaggle forums suggest a mixture of the two. - Along with a rising overall supply of data scientists, we have also seen rising demand, as the number of competitions has been steadily increasing. This could simply reflect rising interest in the Kaggle platform, but it might also point to a rising interest in data science at the corporate level.
Inconclusive Conclusions
It’s hard to generalize from this data, as it call came within the context of a platform. You can think of Kaggle as a fisherman that has gradually invested in better technology and better bait. Over time, more data scientists and more companies have been “caught,” but whether that reflects the better bait, or the fact that the number of fish in the ocean is increasing, it is hard to say.So what can we conclude? A few key items jump off the page:
- People will enter the field of data science, but only if they can find something interesting/rewarding to work on. We see a lot of active unique entrants in a few competitions that have low barriers to entry or offer commensurately high rewards. We also see a rising amount of new users surrounding particularly interesting competitions.
- Problems that are less exciting, or perhaps less accessible, may need to be reformulated to appeal to the mainstream data community, and crossovers from other fields. If a company wants to attract high quality talent, they need to interest and engage them. We see a lot of competitions get very little traction.
- The amount of new users on Kaggle seems fairly steady. This may indicate that demand may soon outstrip supply, as more competitions are run without a commensurate increase in the number of participants, but it does seem like the number of participants and competition count is pretty correlated.
The fact that there is a constant stream of new users is also encouraging, because, anecdotally, most people in the data community heard about Kaggle months ago. This indicates that both existing data scientists are always looking for interesting problems to tackle, and that new people are moving into data science as they see interesting problems. - Corporate interest in data science overall seems to be increasing more quickly than the supply of new data scientists.
To leave a comment for the author, please follow the link and comment on their blog: R, Ruby, and Finance.
R-bloggers.com offers daily e-mail updates about R news and tutorials about learning R and many other topics. Click here if you're looking to post or find an R/data-science job.
Want to share your content on R-bloggers? click here if you have a blog, or here if you don't.