
Generating Dynamic Nomograms using DynNom
Want to share your content on R-bloggers? click here if you have a blog, or here if you don't.
Nomograms are useful computational tools for model visualisation, graphical assessment of variable importance and the calculation of predicted values. The nomogram function in the rms package is a popular way of creating (static) nomograms for a variety of regression models. For example, the following code will generate a nomogram from a logistic regression model used to model the probability of survival on the titanic (http://biostat.mc.vanderbilt.edu/wiki/pub/Main/DataSets/titanic.html)
library(PASWR)

data(titanic3)

library("rms")

t.data <- datadist(titanic3)

options(datadist = 't.data')

fit <- lrm(formula = survived ~ age + pclass + sex, data = titanic3)

plot(nomogram(fit, fun = function(x)plogis(x)))
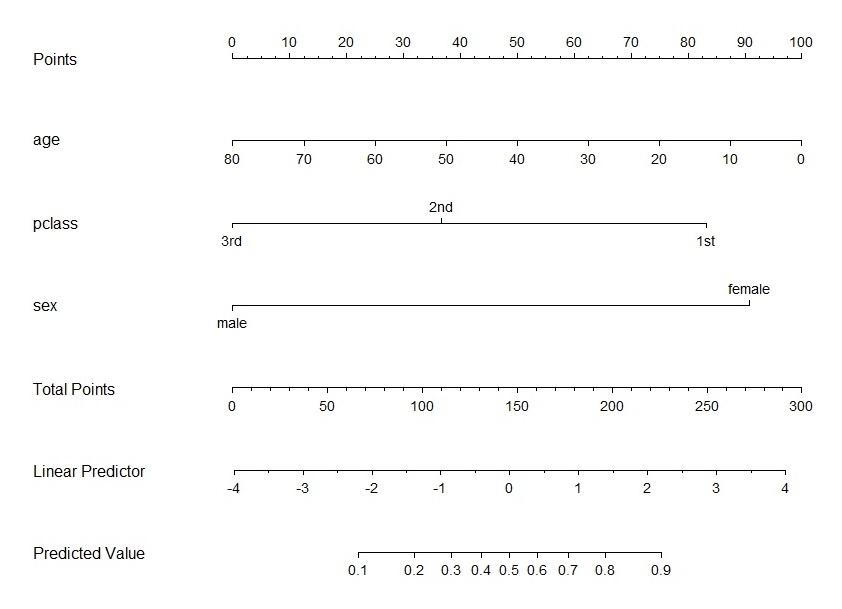
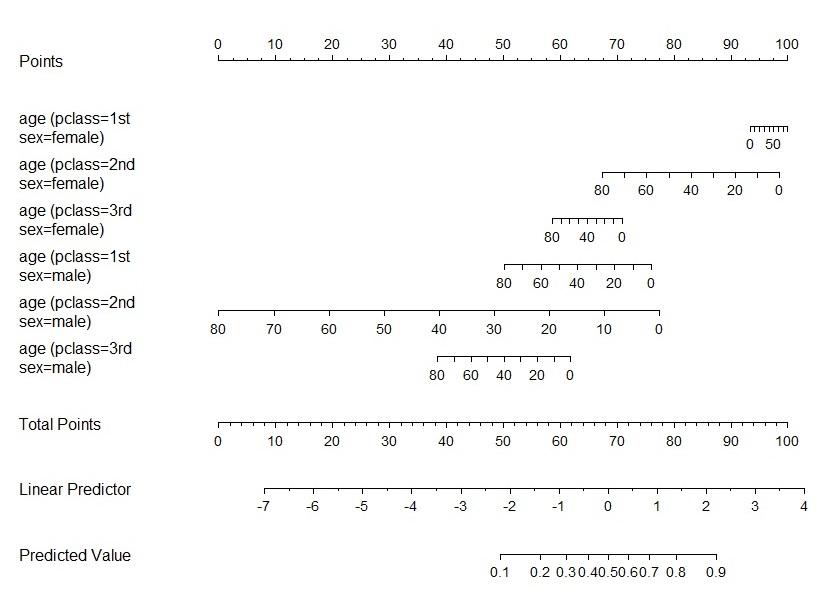
This nomogram is a graphical calculator of the probability of surviving the Titanic, based on three explanatory variables, sex, age and passenger class. The nomogram can become more cumbersome to read and use when higher order interaction terms and smoothers are present in the model. For example, consider the following nomogram of the model containing all possible interactions of the three main effects.
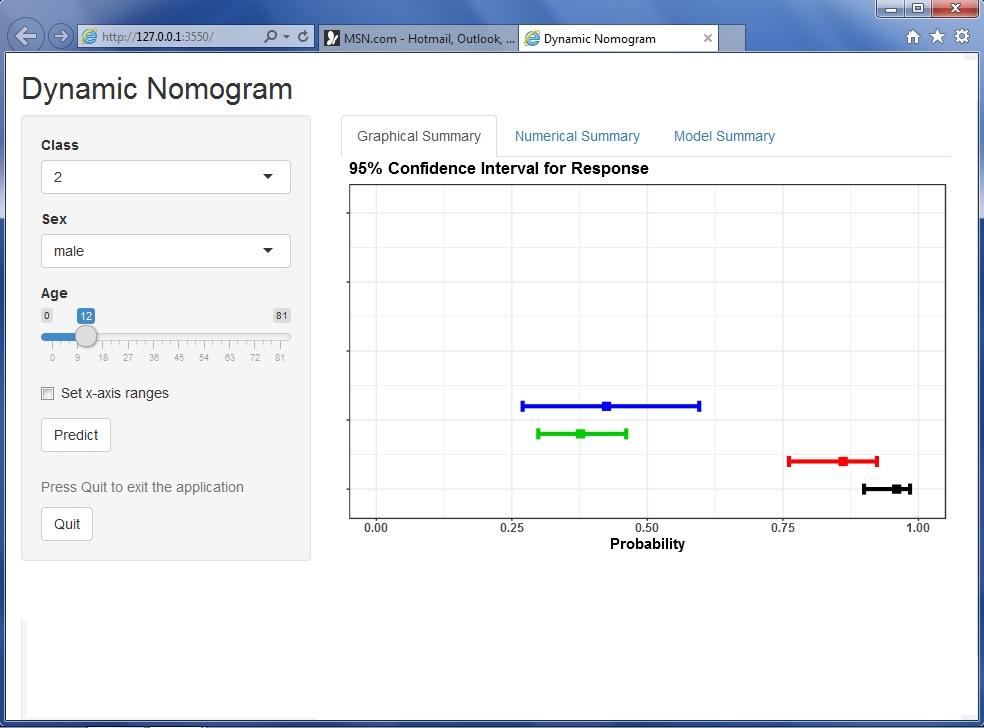
The DynNom package (Jalali, A, Newell, J), built on shiny, allows the creation of dynamic nomograms from any Generalised Linear models or Cox Proportional hazards models. DynNom supports model objects created by the lm, glm and coxph functions. It also supports models generated using the Ols, Glm, lrm and cph in the rms package which allows the inclusion of smoothing splines. For example, the following R code will build a dynamic nomogram for the corresponding higher order logistic regression model using the DynNom package.
fit2 <- glm(survived ~ (age + pclass + sex) ^ 3, titanic3, family = "binomial")
library(DynNom)
DynNom(fit2, titanic3)
The resulting dynamic nomogram allows the prediction of the probability of survival (and corresponding 95% Confidence interval) for any chosen set of values of the explanatory variables. The shiny tabs display the corresponding predicted values graphically and numerically and the underlying model summary.
The ability to interact with a model, in terms of the effect of changes in the explanatory variables on the predicted response, is a useful translational tool. In theory all published model summaries could be accompanied with a hyperlink directing the reader to the corresponding model nomogram. In order to do this the DNbuilder function within DynNom will generate the necessary ui.R, server.R and global.r files needed to share the nomogram online in any server (e.g. http://shinyapps.io).
For example, the dynamic nomogram created for the titanic dataset, published using the DNbuilder function, is available at https://amir.shinyapps.io/titanic.
R-bloggers.com offers daily e-mail updates about R news and tutorials about learning R and many other topics. Click here if you're looking to post or find an R/data-science job.
Want to share your content on R-bloggers? click here if you have a blog, or here if you don't.