
Evaluating BreakoutDetection
Want to share your content on R-bloggers? click here if you have a blog, or here if you don't.
A couple of weeks ago, Twitter open-sourced their BreakoutDetection package for R, a package designed to determine shifts in time-series data. The Twitter announcement does a great job of explaining the main technique for detection (E-Divisive with Medians), so I won’t rehash that material here. Rather, I wanted to see how this package works relative to the anomaly detection feature in the Adobe Analytics API, which I’ve written about previously.
Getting Time-Series Data Using RSiteCatalyst
To use a real-world dataset to evaluate this package, I’m going to use roughly ten months of daily pageviews generated from my blog. The hypothesis here is that if the BreakoutDetection package works well, it should be able to detect the boundaries around when I publish a blog post (of which the dates I know with certainty) and when articles of mine get shared on sites such as Reddit. From past experience, I get about a 3-day lift in pageviews post-publishing, as the article gets tweeted out, published on R-Bloggers or JuliaBloggers and shared accordingly.
Here’s the code to get daily pageviews using RSiteCatalyst (Adobe Analytics):One thing to notice here is that BreakoutDetection requires either a single R vector or a specifically formatted data frame. In this case, because I have a timestamp, I use lines 17-18 to get the data into the required format.
BreakoutDetection – Default Example
In the Twitter announcement, they provide an example, so let’s evaluate those defaults first:

In order to validate my hypothesis, the package would need to detect 12 ‘breakouts’ or so, as I’ve published 12 blog posts during the sample time period. Mentally drawing lines between the red boundaries, we can see three definitive upward mean shifts, but far fewer than the 12 I expected.
BreakoutDetection – Modifying The Parameters
Given that the chart above doesn’t fit how I think my data are generated, we can modify two main parameters: beta and min.size. From the documentation:
- beta: A real numbered constant used to further control the amount of penalization. This is the default form of penalization, if neither (or both) beta or (and) percent are supplied this argument will be used. The default value is beta=0.008.
- min.size: The minimum number of observations between change points
The first parameter I’m going to experiment with is min.size, because it requires no in-depth knowledge of the EDM technique! The value used in the first example was 24 (days) between intervals, which seems extreme in my case. It’s reasonable that I might publish a blog post per week, so let’s back that number down to 5 and see how the result changes: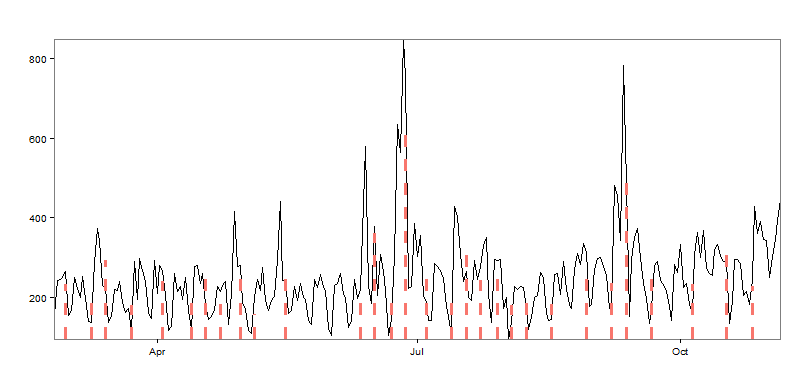
With 17 predicted intervals, we’ve somewhat overshot the number of blog posts mark. Not that the package is wrong per se; the boundaries are surrounding many of the spikes in the data, but perhaps having this many breakpoints isn’t useful from a monitoring standpoint. So setting the min.size parameter somewhere between 5 and 24 points would give us more than 3 breakouts, but less than 17. There is also the beta parameter that can be played with, but I’ll leave that as an exercise for another day.
Anomaly Detection – Adobe Analytics
From my prior post about Anomaly Detection with the Adobe Analytics API, Adobe has chosen to use Holt-Winters/Exponential Smoothing as their technique. Here’s what that looks like for the same time-period (code as GitHub Gist):

Even though the idea of both techniques are similar, it’s clear that the two methods don’t quite represent the same thing. In the case of the Adobe Analytics Anomaly Detection, it’s looking datapoint-by-datapoint, with a smoothing model built from the prior 35 points. If a point exceeds the upper- or lower-control limits, then it’s an anomaly, but not necessarily indicative of a true level shift like the BreakoutDetection package is measuring.
Conclusion
The BreakoutDetection package is definitely cool, but it is a bit raw, especially the default graphics. But the package definitely does work, as evidenced by how well it put boundaries around the traffic spikes when I set the min.size parameter equal to five.
Additionally, I tried to read more about the underlying methodology, but the only references that come up in Google seem to be references to the R package itself! I wish I had a better feeling for how the beta parameter influences the graph, but I guess that will come over time as I use the package more. But I’m definitely glad that Twitter open-sourced this package, as I’ve often wondered about how to detect level shifts in a more operational setting, and now I have a method to do so.
R-bloggers.com offers daily e-mail updates about R news and tutorials about learning R and many other topics. Click here if you're looking to post or find an R/data-science job.
Want to share your content on R-bloggers? click here if you have a blog, or here if you don't.