
Crayon colors in R
Want to share your content on R-bloggers? click here if you have a blog, or here if you don't.
Last night I was working on a talk on creating effective graphs. Mostly, I needed to update the colors, as there’d been some gaudy ones in its previous form (e.g., slide 22).
I usually pick colors using the crayons in the Mac Color Picker. But that has just 40 crayons, and I wanted more choices.
That led me to the list of Crayola crayon colors on wikipedia. I wrote a ruby script to grab the color names and codes and added them to my R/broman package.
Use brocolors("crayons") to get the list of colors. For example, to get “Tickle Me Pink, &rdqou; use
library(broman)
pink <- brocolors("crayons")["Tickle Me Pink"]
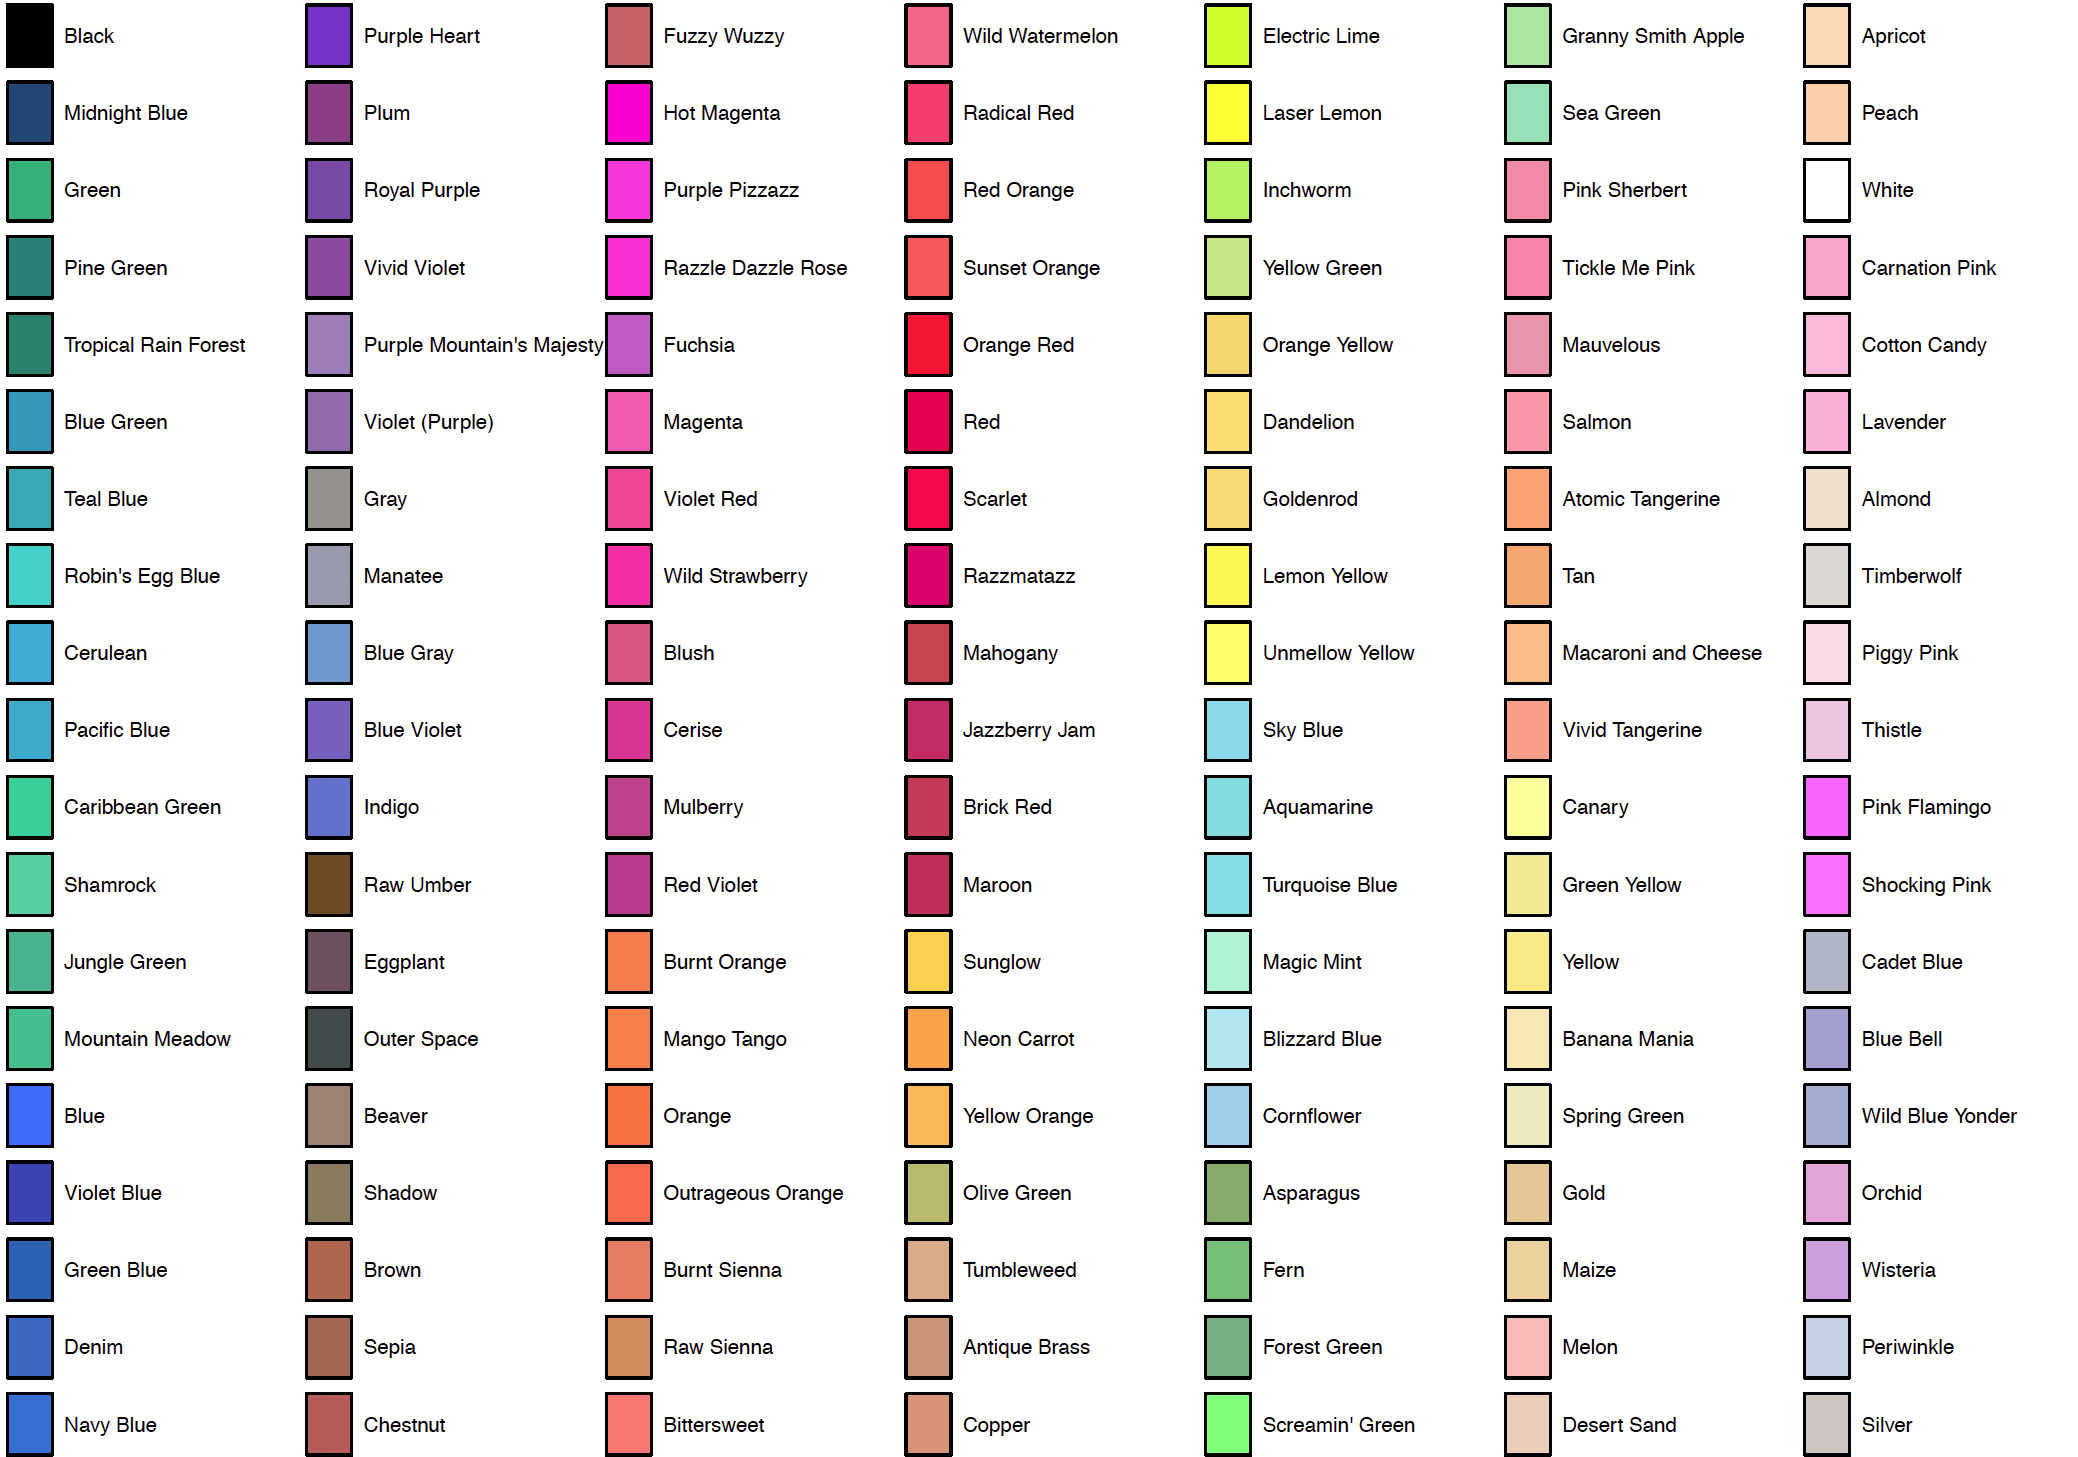
Use plot_crayons() to get the following summary plot of the colors:
You can install the R/broman package using install_github in devtools, (specifically, install_github("kbroman/broman")) or wait a day or two and the version with this code will be on CRAN.

R-bloggers.com offers daily e-mail updates about R news and tutorials about learning R and many other topics. Click here if you're looking to post or find an R/data-science job.
Want to share your content on R-bloggers? click here if you have a blog, or here if you don't.