
Articles by Rsquared Academy Blog
Introduction
This is the second post in the series R & Databases. You can find the links to the first post of this series below:
Quick Guide: R & SQLite
In this post, we will learn to query data from a database using dplyr.
Libraries, Code & Data
We will use the following ... [Read more...]
Quick Guide: R & SQLite
Introduction
This is the first post in the series R & Databases. You can find the links to the other two posts of this series below:
Data Wrangling with dbplyr
SQL for Data Science - Part 1
SQL for Data Science - Part 2
In this post, we will learn to:
connect to ... [Read more...]
Categorical Data Analysis using forcats
Introduction
In this post, we will learn to work with categorical/qualitative data in R
using forcats. Let us begin by installing
and loading forcats and a set of other pacakges we will be using.
Libraries & Code
We will use the following packages:
forcats
dplyr
magrittr
ggplot2
tibbe
purrr
and ...
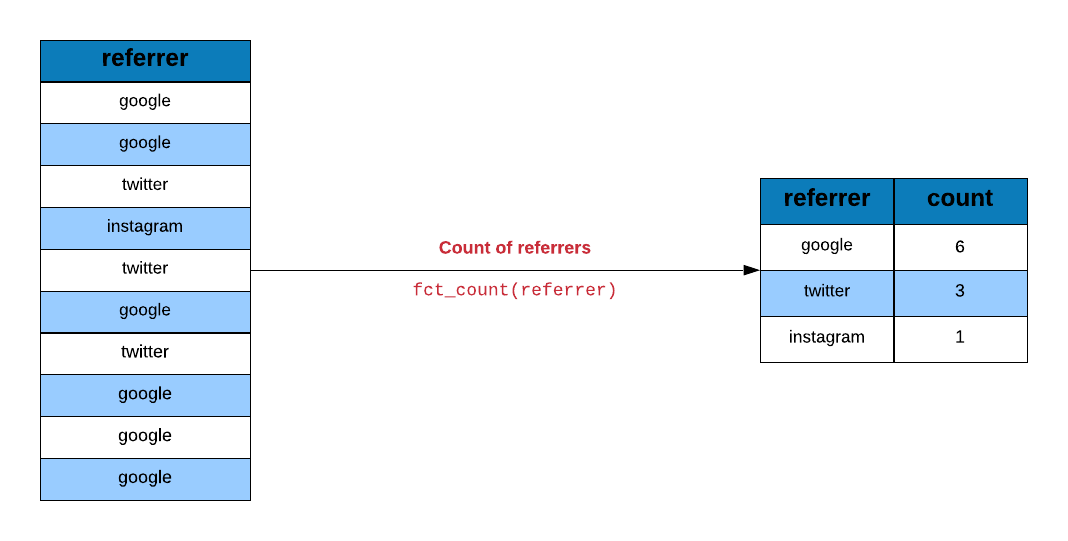
Working with Date and Time in R
Introduction
In this post, we will learn to work with date/time data in R using lubridate, an R package that makes it easy to work with dates and time.
Let us begin by installing and loading the pacakge.
Libraries, Code & Data
We will use the following packages:
lubridate
dplyr
...

Hacking strings with stringr
Introduction
In this post, we will learn to work with string data in R using stringr. As we did in the other posts, we will use a case study to explore the various features of the stringr package. Let us begin by installing and loading stringr and a set of ...
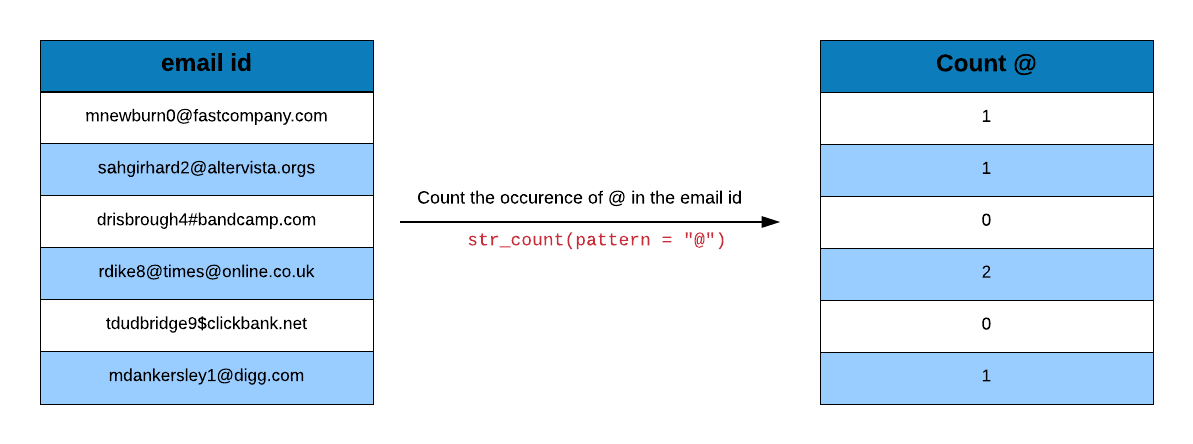
Readable Code with Pipes
Introduction
R code contain a lot of parentheses in case of a sequence of multiple operations. When you are dealing with
complex code, it results in nested function calls which are hard to read and maintain. The magrittr package by Stefan Milton Bache provides pipes enabling us to write R ...
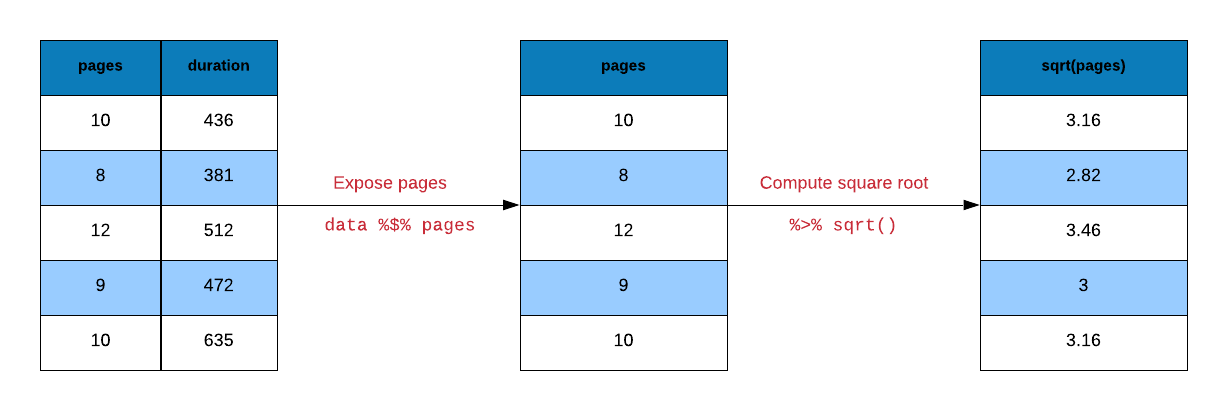
Introduction to tibbles
Introduction
A tibble, or tbl_df, is a modern reimagining of the data.frame, keeping what time has proven to be effective, and throwing out what is not. Tibbles are data.frames that are lazy and surly: they do less (i.e. they don’t change variable names or types, ... [Read more...]
Data Wrangling with dplyr – Part 3
Introduction
In the previous post,
we learnt to combine tables using dplyr. In this post, we will explore a set of
helper functions in order to:
extract unique rows
rename columns
sample data
extract columns
slice rows
arrange rows
compare tables
extract/mutate data using predicate functions
count observations for ...
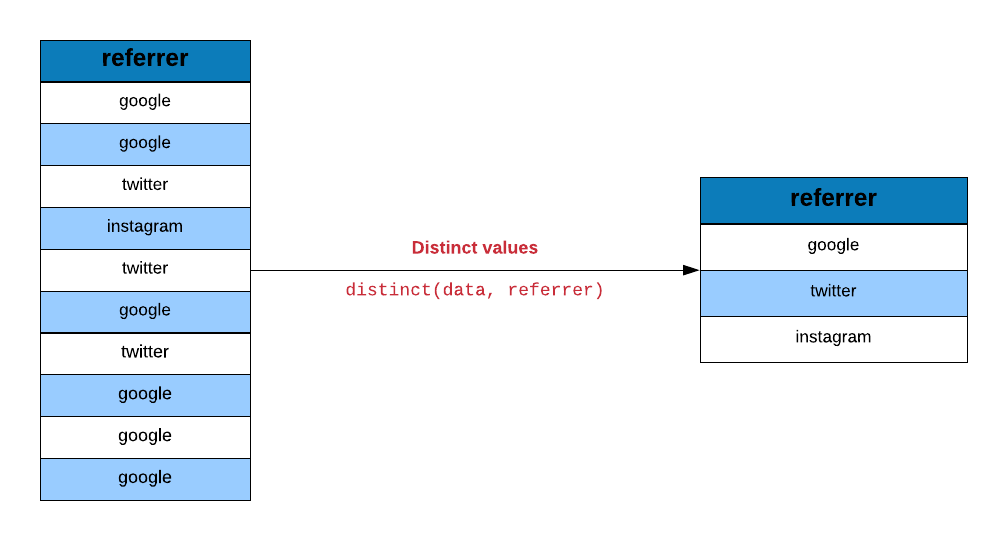
Data Wrangling with dplyr – Part 2
Introduction
In the previous post we learnt about dplyr verbs and used them to compute
average order value for an online retail company data. In this post, we will
learn to combine tables using different *_join functions provided in dplyr.
Libraries, Code & Data
We will use the following packages:
dplyr
...

Data Wrangling with dplyr – Part 1
Introduction
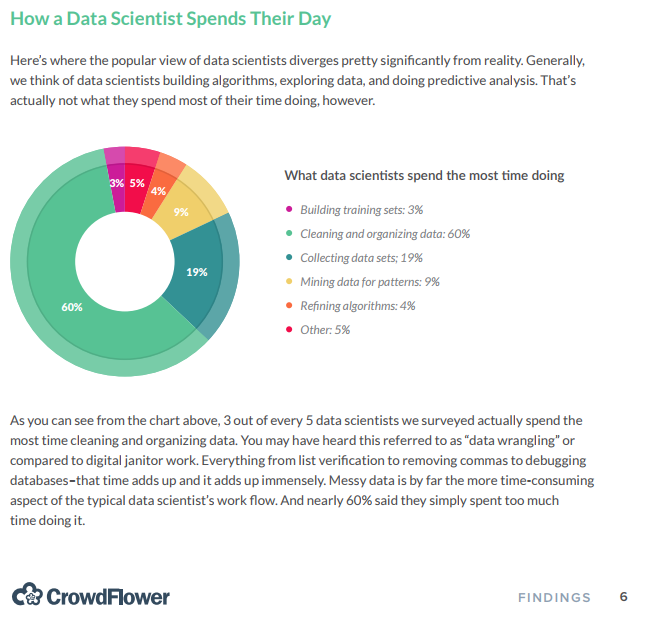
According to a survey by CrowdFlower, data scientists spend most of their
time cleaning and manipulating data rather than mining or modeling them for
insights. As such, it becomes important to have tools that make data
manipulation faster and easier. In today’s post, we introduce you to
dplyr, ...
Import Data into R – Part 2
Introduction
This is the second post in the series Importing Data into R. In the
previous post, we explored reading data from flat/delimited files. In this
post, we will:
list sheets in an excel file
read data from an excel sheet
read specific cells from an excel sheet
read ...

Import Data into R – Part 1
Introduction
In this post, we will learn to:
read data from flat or delimited files
handle column names/header
skip text/info present before data
specify column/variable types
read specific columns/variables
Libraries, Data & Code
We will use the readr package. The
data sets can be downloaded from here
...

ggplot2: Themes
Introduction
This is the last post in the series Elegant Data Visualization with ggplot2.
In the previous post, we learnt to combine multiple plots. In this post, we
will learn to modify the appearance of all non data components of the plot such
as:
axis
legend
panel
plot area
background
...
ggplot2: Faceting
Introduction
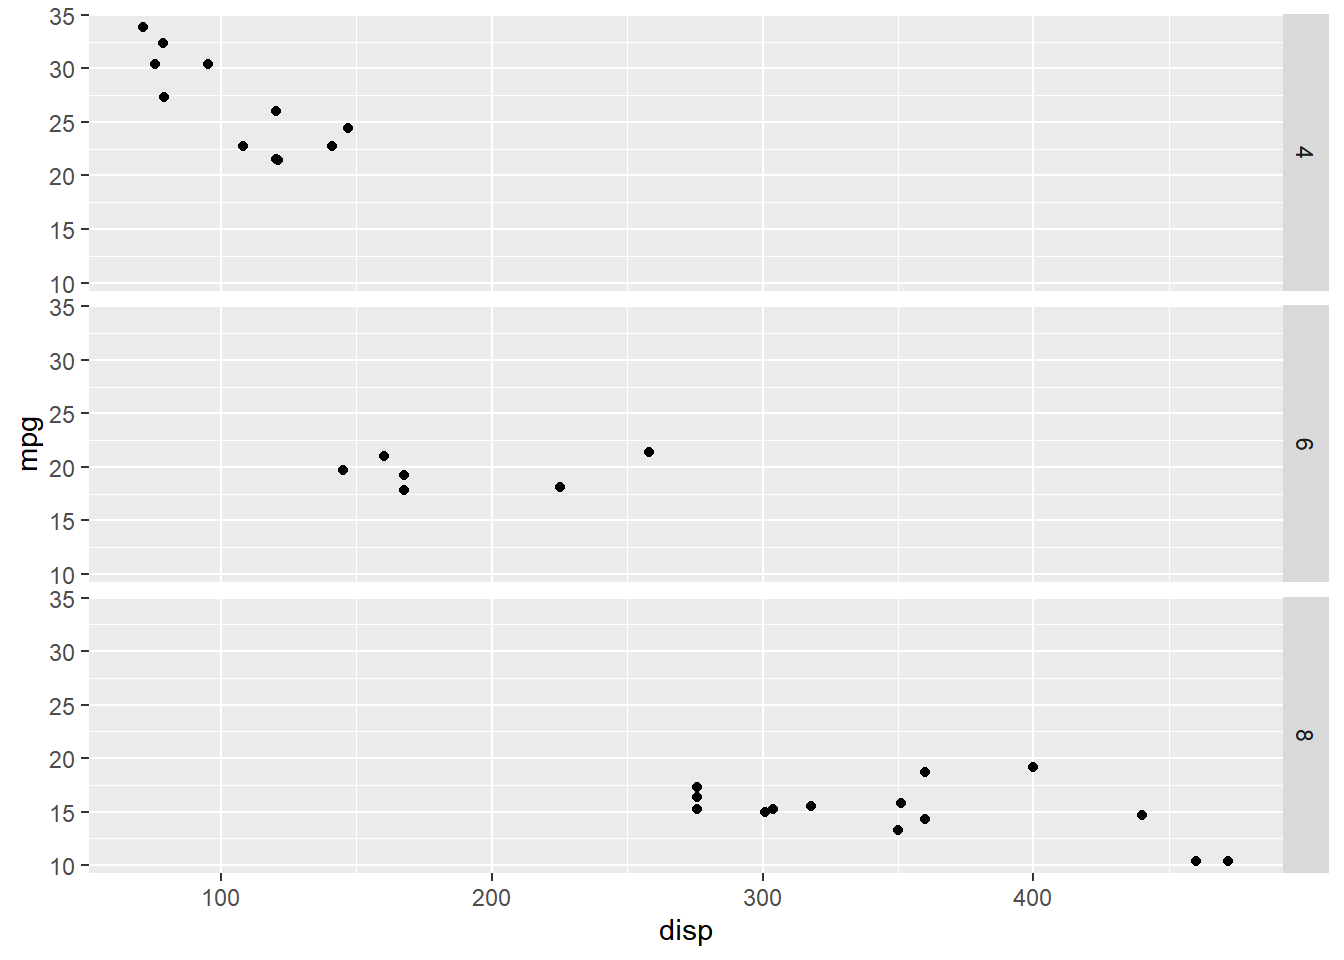
This is the 19th post in the series Elegant Data Visualization with ggplot2.
In the previous post, we learnt to modify the title, label and bar of a legend.
In this post, we will learn about faceting i.e. combining plots.
Libraries, Code & Data
We will use the following ...
ggplot2: Legend – Part 6
Introduction
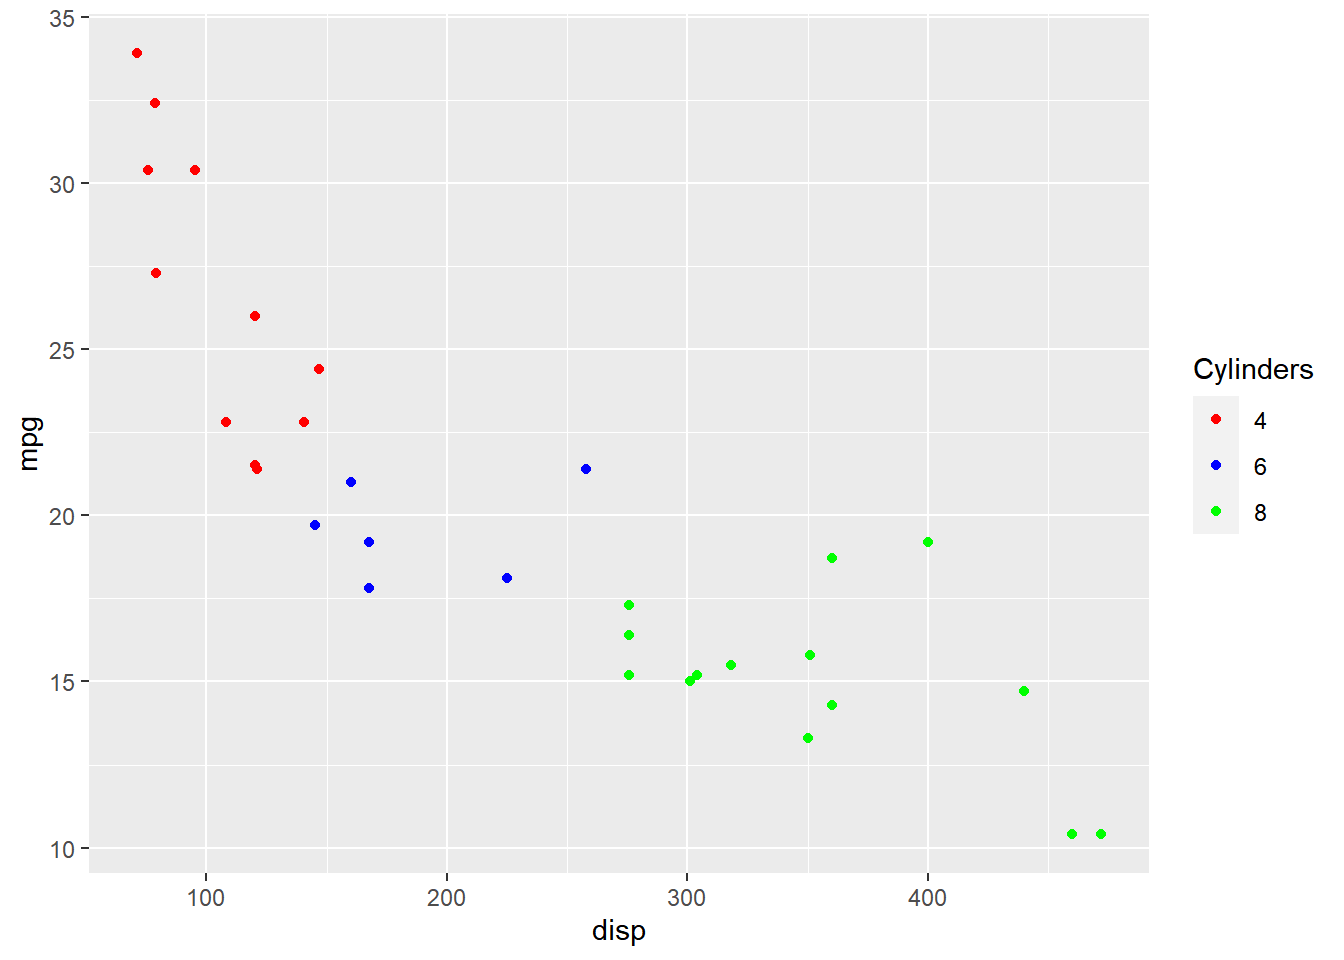
This is the 18th post in the series Elegant Data Visualization with ggplot2.
In the previous post, we learnt how to modify the legend of plot when alpha
is mapped to a categorical variable. In this post, we will learn to modify legend
title
label
and bar
So far, ...
ggplot2: Legend – Part 5
Introduction
This is the 17th post in the series Elegant Data Visualization with ggplot2.
In the previous post, we learnt how to modify the legend of plot when size is
mapped to continuous variable. In this post, we will learn to modify the
following using scale_alpha_continuous() when alpha ...

ggplot2: Legend – Part 4
Introduction
This is the 16th post in the series Elegant Data Visualization with ggplot2.
In the previous post, we learnt how to modify the legend of plot when shape
is mapped to categorical variables. In this post, we will learn to modify the
following using scale_size_continuous when size ...
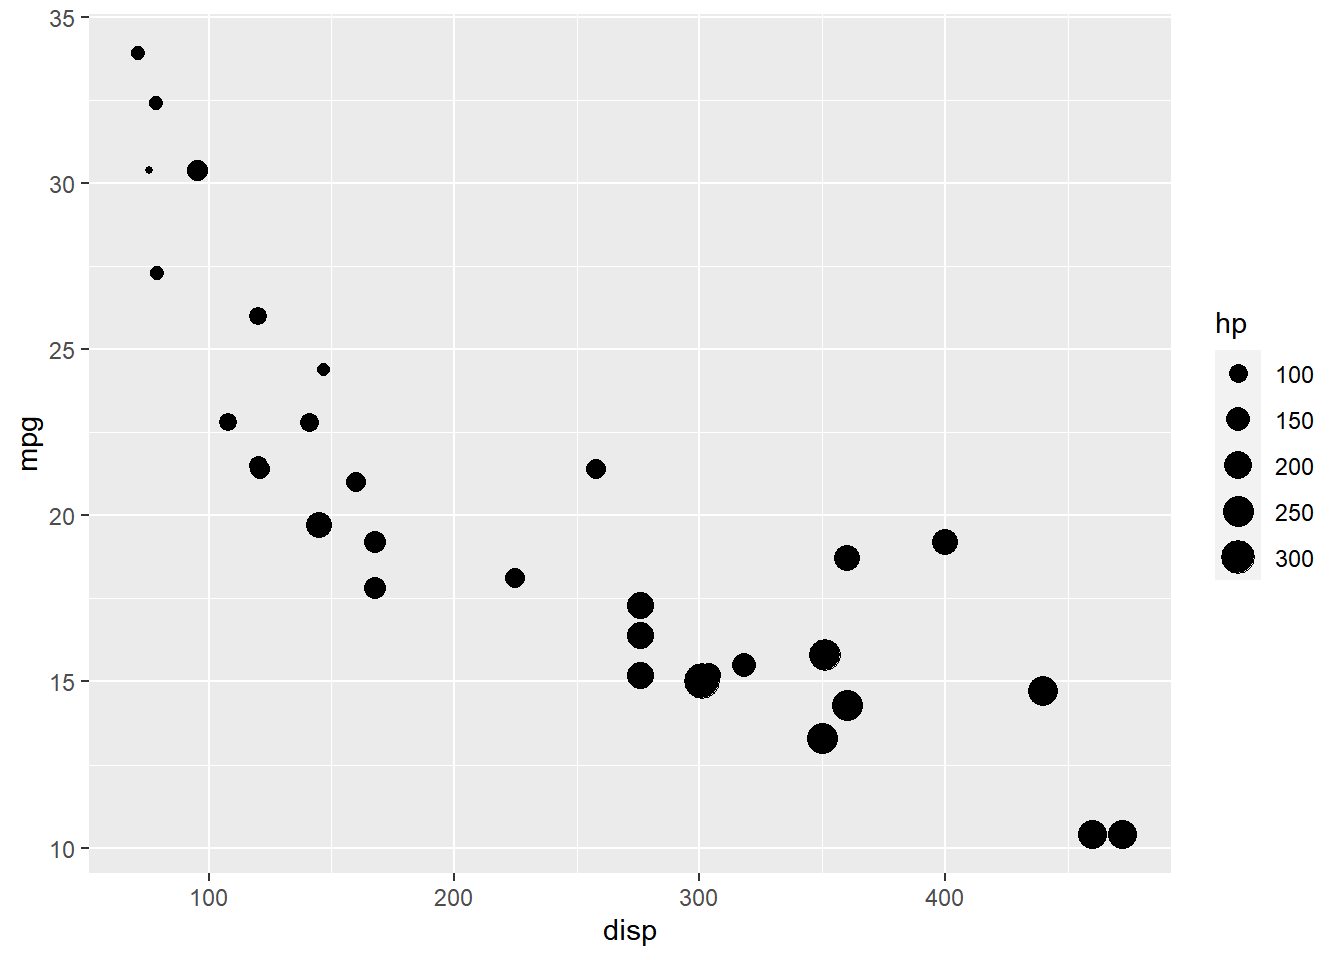
ggplot2: Legend – Part 3
Introduction
This is the 15th post in the series Elegant Data Visualization with ggplot2.
In the previous post, we learnt how to modify the legend of plots when
aesthetics are mapped to variables..In this post, we will learn to modify the
following using scale_shape_manual when shape is ...
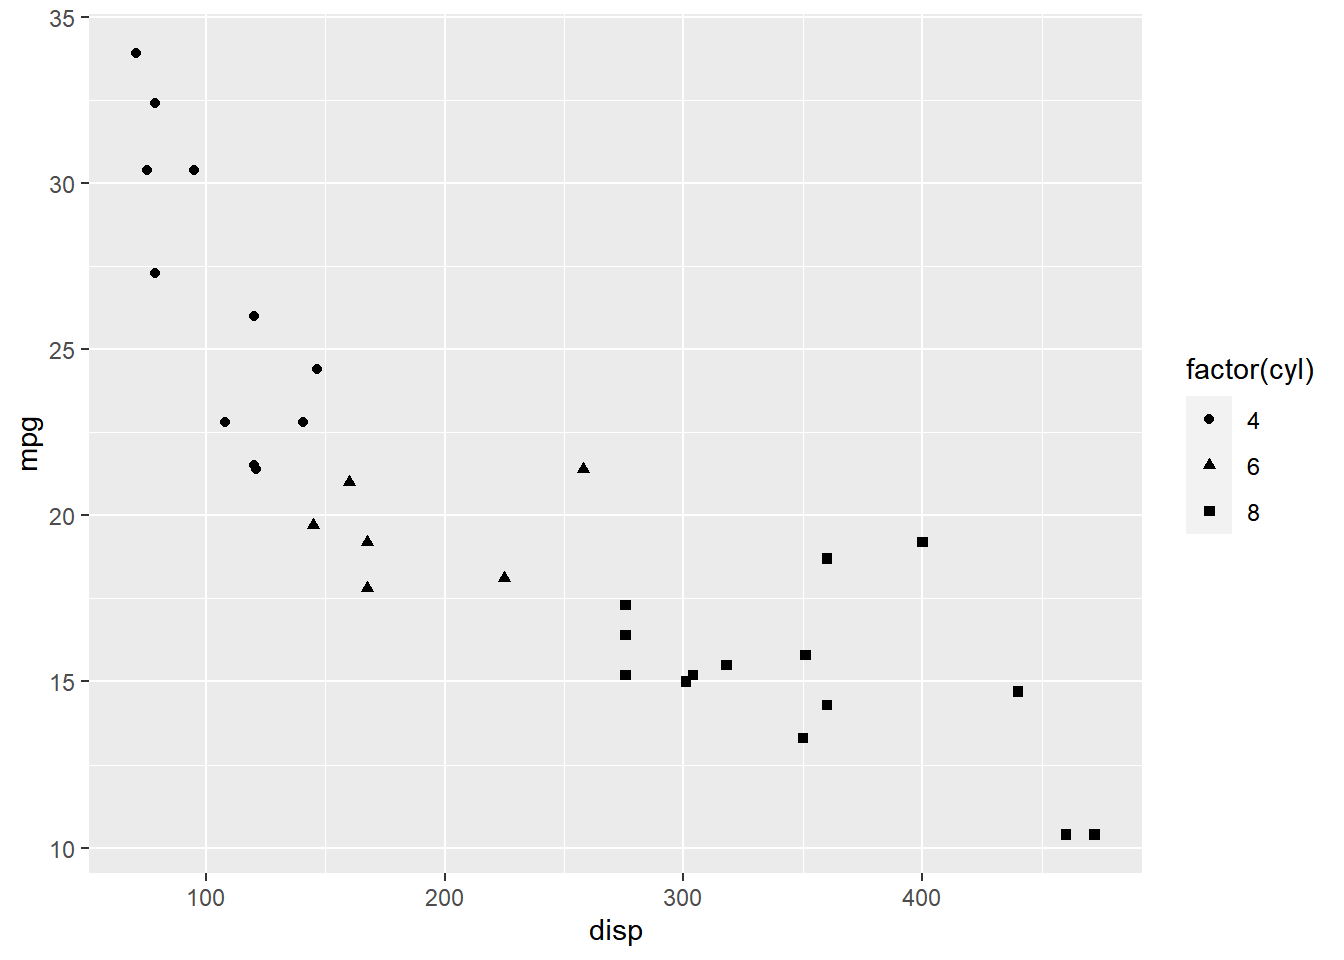
ggplot2: Legend – Part 2
Introduction
This is the 14th post in the series Elegant Data Visualization with ggplot2.
In the previous post, we learnt how to modify the legend of plots when
aesthetics are mapped to variables. In this post, we will continue to explore
different ways to modify/customize the legend of plots.
...
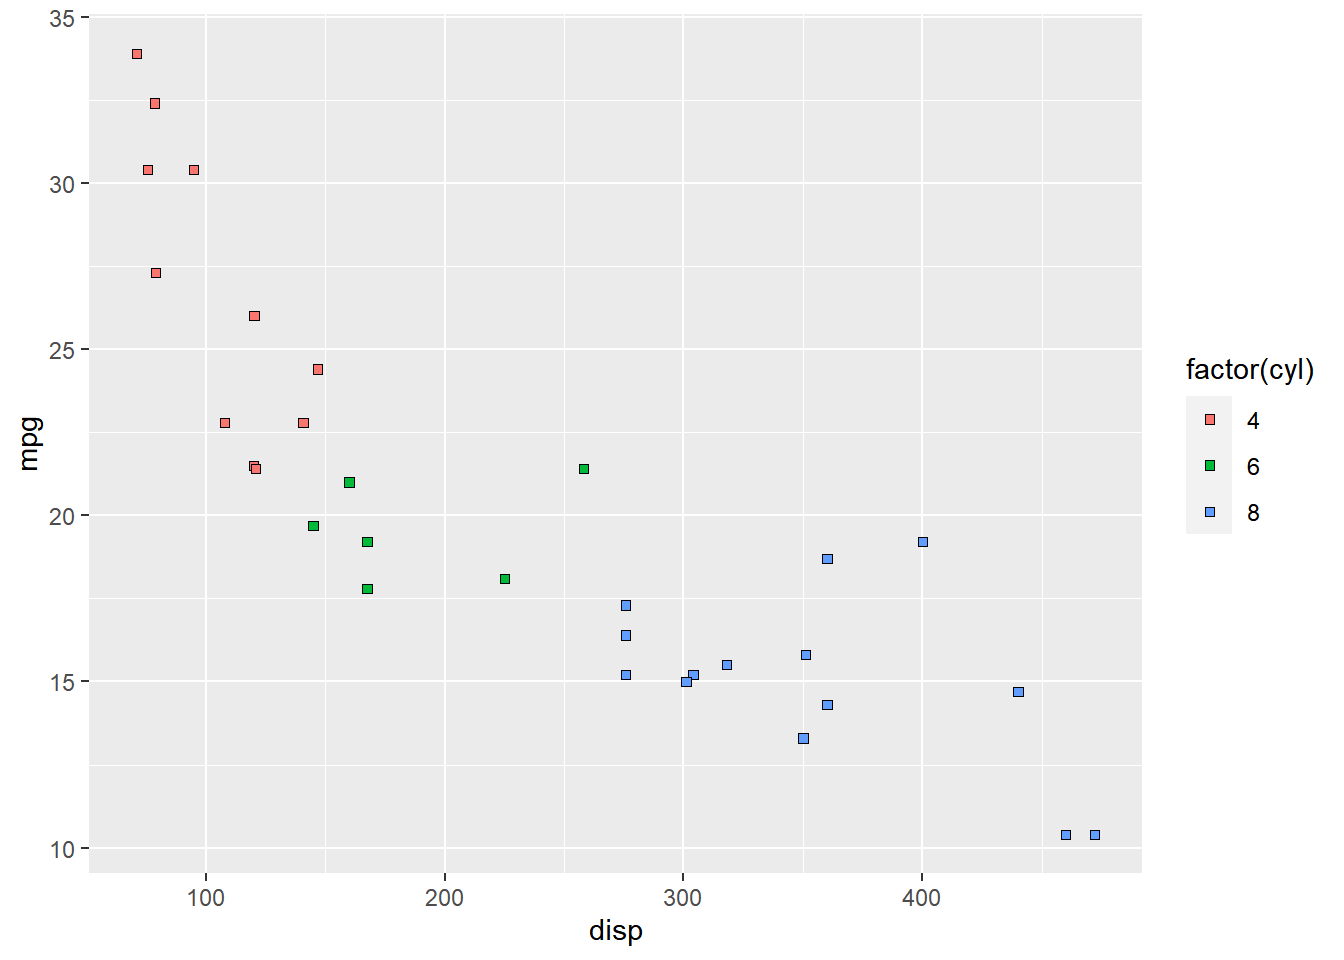
ggplot2: Legend – Part 1
Introduction
This is the 13th post in the series Elegant Data Visualization with
ggplot2. In the previos post, we learnt how to modify the axis of plots. In
this post, we will focus on modifying the appearance of legend of plots when
the aesthetics are mapped to variables. Specifically, we ...
Copyright © 2022 | MH Corporate basic by MH Themes