Articles by Analysis of AFL

Taking Home Charlie

September 16, 2018 | Analysis of AFL

Build your own Brownlow Model G’day all, your friendly neighbourhood PhD student here. I am here to help you all build your own models. That is very different from what you might be used to which could consist of any one of the following scenarios. Here is a model ...
[Read more...]

fitzRoy – 0.1.5 release

August 14, 2018 | Analysis of AFL

For those of you who’ve been following me on Twitter, you’ll know that I’ve been working on an R package for AFL called fitzRoy with Rob from Analysis of AFL. Today we released a new version which has a much requested feature, so I’d figured a ... [Read more...]

Build a Quick Elo

July 22, 2018 | Analysis of AFL

One of my favourite sites is squiggle, mainly because I like to check out what other people have tipped, what their respective margins are and how they are aligned. As some of you know James and I have been working on an AFL R package called fitzRoy One of our ... [Read more...]

The Richmond Red Zone

July 16, 2018 | Analysis of AFL

So watching footyclassified and Matthew Lloyd made a comment that it would seem as though the key to beating Richmond is controlling the ball via having more kicks to handballs. Got me thinking, wouldn’t that be cool if a plot showed the same insight that an industry professional had? ...
[Read more...]

Exploring Different Squigglers HGA

June 29, 2018 | Analysis of AFL

library(fitzRoy)
library(tidyverse)
## -- Attaching packages --------------------------------------------------- tidyverse 1.2.1 --
## v ggplot2 2.2.1     v purrr   0.2.5
## v tibble  1.4.2     v dplyr   0.7.5
## v tidyr   0.8.1     v stringr 1.3.1
## v readr   1.1.1     v forcats 0.3.0
## -- Conflicts ------------------------------------------------------ tidyverse_conflicts() --
## x dplyr::filter() masks stats::filter()
## x dplyr::lag()    masks stats::lag()
library(lubridate)
## 
## Attaching package: 'lubridate'
## The following object is masked from 'package:base':
## 
##     date
library(mgcv)
## Loading required package: nlme
## 
## Attaching package: 'nlme'
## The following object is masked from 'package:dplyr':
## 
##     collapse
## This is mgcv 1.8-23. For overview type 'help("mgcv-package")'.
afltables<-fitzRoy::get_match_results()
tips <- get_squiggle_data("tips")
## Getting data from https://api.squiggle.com.au/?q=tips
afltables<-afltables%>%mutate(Home.Team = str_replace(Home.Team, "GWS", "Greater Western Sydney"))

afltables<-afltables %>%mutate(Home.Team = str_replace(Home.Team, "Footscray", "Western Bulldogs"))

unique(afltables$Home.Team)
##  [1] "Fitzroy"                "Collingwood"           
##  [3] "Geelong"                "Sydney"                
##  [5] "Essendon"               "St Kilda"              
##  [7] "Melbourne"              "Carlton"               
##  [9] "Richmond"               "University"            
## [11] "Hawthorn"               "North Melbourne"       
## [13] "Western Bulldogs"       "West Coast"            
## [15] "Brisbane Lions"         "Adelaide"              
## [17] "Fremantle"              "Port Adelaide"         
## [19] "Gold Coast"             "Greater Western Sydney"
names(afltables)
##  [1] "Game"         "Date"         "Round"        "Home.Team"   
##  [5] "Home.Goals"   "Home.Behinds" "Home.Points"  "Away.Team"   
##  [9] "Away.Goals"   "Away.Behinds" "Away.Points"  "Venue"       
## [13] "Margin"       "Season"       "Round.Type"   "Round.Number"
names(tips)
##  [1] "venue"       "hteamid"     "tip"         "correct"     "date"       
##  [6] "round"       "ateam"       "bits"        "year"        "confidence" 
## [11] "updated"     "tipteamid"   "gameid"      "ateamid"     "err"        
## [16] "sourceid"    "margin"      "source"      "hconfidence" "hteam"
tips$date<-ymd_hms(tips$date)

tips$date<-as.Date(tips$date)

afltables$Date<-ymd(afltables$Date)
joined_dataset<-left_join(tips, afltables, by=c("hteam"="Home.Team", "date"="Date"))

df<-joined_dataset%>%
  select(hteam, ateam,tip,correct, hconfidence, round, date,
         source, margin, Home.Points, Away.Points, year)%>%
  mutate(squigglehomemargin=if_else(hteam==tip, margin, -margin), 
         actualhomemargin=Home.Points-Away.Points, 
         hconfidence=hconfidence/100)%>%
  filter(source=="PlusSixOne")%>%
    select(round, hteam, ateam, hconfidence, squigglehomemargin, actualhomemargin, correct)
df<-df[complete.cases(df),]

df$hteam<-as.factor(df$hteam)
df$ateam<-as.factor(df$ateam)
ft=gam(I(actualhomemargin>0)~s(hconfidence),data=df,family="binomial")

df$logitChance = log(df$hconfidence)/log(100-df$hconfidence)


ft=gam(I(actualhomemargin>0)~s(logitChance),data=df,family="binomial")


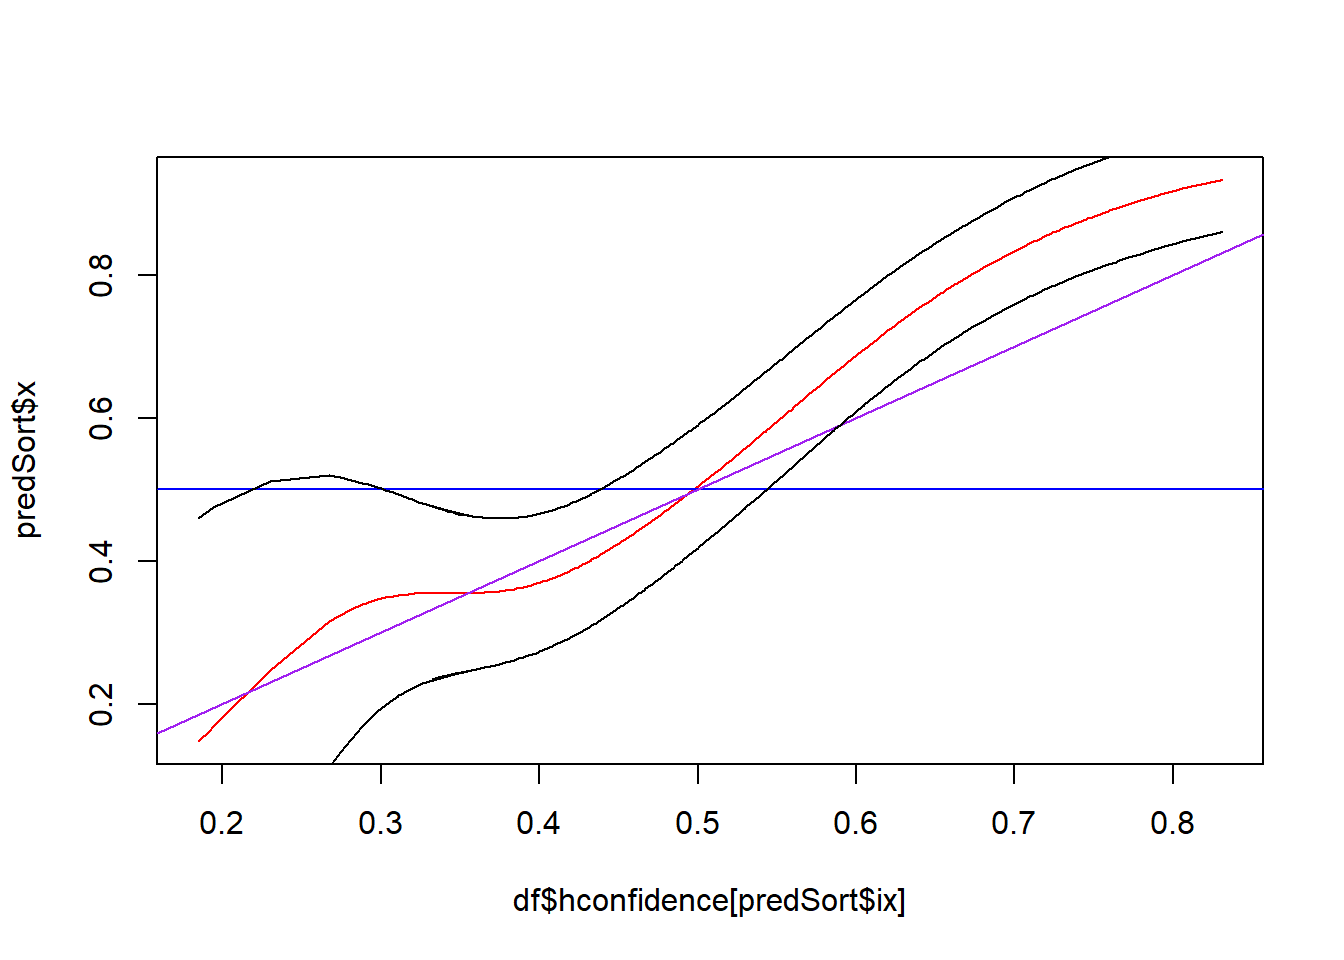
preds = predict(ft,type="response",se.fit=TRUE)
predSort=sort(preds$fit,index.return=TRUE)

plot(predSort$x~df$hconfidence[predSort$ix],col="red",type="l")

abline(h=0.5,col="blue")
abline(v=50,col="blue")
abline(c(0,1),col="purple")
lines(df$hconfidence[predSort$ix],predSort$x+2*preds$se.fit[predSort$ix])
lines(df$hconfidence[predSort$ix],predSort$x-2*preds$se.fit[predSort$ix])
# predicting winners
ft=gam(I(actualhomemargin>0)~s(hconfidence),data=df,family="binomial",sp=0.05)
# the 0.05 was to make it a bit wiggly but not too silly (the default was not monotonically increasing, which is silly)
plot(ft,rug=FALSE,trans=binomial()$linkinv)
abline(h=0.5,col="blue")
abline(v=0.5,col="blue")
abline(c(0,1),col="purple")
# predicting margins
ft=gam(actualhomemargin~s(hconfidence),data=df)
plot(ft,rug=FALSE,residual=TRUE,pch=1,cex=0.4)
abline(h=0.5,col="blue")
abline(v=0.5,col="blue")

# add squiggle margins to the plot
confSort = sort(df$hconfidence,index.return=TRUE)
lines(confSort$x,df$squigglehomemargin[confSort$ix],col="purple")
[Read more...]

Joining Betting Data

June 26, 2018 | Analysis of AFL

This example will be using Betfair which we hope to add to fitzRoy in the future. Making it easier to compare Squiggle and maybe your own models vs the market! Step One Read in the Betfair Data The first step is just go to the betfair site and download the ... [Read more...]

A Different Free Kick Ladder

June 24, 2018 | Analysis of AFL

Each week triplemfooty tweets out a free kick ladder that is based only on total free kick differential throughout the season. But what if we did a ladder in the same style of the home and away ladder. 4 points for a win (winning free kick count in game) 2 points for ...
[Read more...]

But We Won Everywhere but the Scoreboard

June 22, 2018 | Analysis of AFL

Something that gets to many a footy fan, is the feeling that your team has won the game in most areas expect on the scoreboard. Thinking about this statement a little bit deeper has the following implication. That there are some areas of the game, that if you win, you ... [Read more...]

The Fundamental Principles of Analytical Design

June 21, 2018 | Analysis of AFL

I have just finished reading the book Beautiful Evidence by Edward Tufte and in it he talks about the fundamental principles of analytical design. Henri Matisse I do not paint things, I paint only the differences between things Show Comparisons, Contrasts, Differences When looking at a graph or reading a ...
[Read more...]

Bradley Terry

June 21, 2018 | Analysis of AFL

You might be reading other sites and see lots of posts on ELO models this post isn’t about building an ELO model yourself that’s another post. This post is about how to apply Bradley Terry models for AFL Why Bother? Each of the 18 footy teams plays 22 games a ... [Read more...]

Score Involvements

June 20, 2018 | Analysis of AFL

Got an email from someone who was reading the footballistics book they were really into it and got up to chapter 3. They must be a really big Western Bulldogs fan who has a lot of theories as to why after their premiership year in 2016 it seems they have dropped off ... [Read more...]

Regression to the Mean

June 19, 2018 | Analysis of AFL

We also see this in sports, Hollinger refers to it as the fluke rule. Bill James calls it the plexiglas principle, you might call it the Sports Illustrated Jinx. They all are different names from different people who have observed the same thing mean reversion or regression to the mean. ...
[Read more...]

Linear Regression an Introduction Through AFL

June 16, 2018 | Analysis of AFL

Linear regression is an amazingly powerful concept in statistical modelling. It forms a major part of lots of first year statistics cources and how to deal with problems with linear regression can form second year units by themselves! This post goal is to through the use of AFL data provide ...
[Read more...]

Max Gawn a Brownlow Fancy

June 5, 2018 | Analysis of AFL

This week in AFL Nathan Fyfe one of the brownlow favourites got rubbed out for an ear tickler to Levi Greenwood When looking at the Brownlow odds, its a bit surprising to see Max Gawn listed as the second favourite. While he is having a great season, historically Ruckman have ...
[Read more...]

Is There Another Way to Do Fantasy

May 31, 2018 | Analysis of AFL

Apologies for the rushed nature of post Recently I saw this post on twitter and it got me thinking is there another way? So lets run through the rough problems as outlined in this tweet. Numbers have context (suprising I know!) What time period is best when looking at fantasy ...
[Read more...]

Plotting Background Data

May 24, 2018 | Analysis of AFL

One of the best things about the online R community is there are lots and lots of great people to follow online especially. One person I follow dataandme consistently links great how to do things on R tutorials. Recently I saw this post where she linked a post by drsimonj ...
[Read more...]

Data Viz and Manipulation P2

May 20, 2018 | Analysis of AFL

Using fitzRoy and the tidyverse
library(fitzRoy)
library(tidyverse)
## -- Attaching packages ----------------------- tidyverse 1.2.1 --
## v ggplot2 2.2.1     v purrr   0.2.5
## v tibble  1.4.2     v dplyr   0.7.6
## v tidyr   0.8.1     v stringr 1.3.1
## v readr   1.1.1     v forcats 0.3.0
## -- Conflicts -------------------------- tidyverse_conflicts() --
## x dplyr::filter() masks stats::filter()
## x dplyr::lag()    masks stats::lag()
So what we did before, was we created 3 variables from afltables about Tony Lockett. They were Year (afl season), GM (totals games played in afl season) and GL (total goals kicked in season). These are summary statistics i.e. the year ...
[Read more...]

Data Viz The Glossy

May 20, 2018 | Analysis of AFL

One of the fun things when doing graphs, is that moment when you identify something that sticks out. A great example of this is done by ethan_meldrum In it we can see how much Paul Seedsman 2018 has stood out so far. Lets give it the ggplot/fitzRoy treatment. Step ...
[Read more...]

Data Viz and Manipulation P1

May 19, 2018 | Analysis of AFL

This is the start of the tutorial series, where we will cover visualising and manipulating data in R. There will be a series of mini checkpoints that should be used as a guide to check understanding. To check the most basic functionality of R (you can use it as a ...
[Read more...]

makemeauseR

May 17, 2018 | Analysis of AFL

The best way to learn things in my opinion is through examples. What this part of the site aims to cover an introduction to statistics course one might take at university. But instead of boring examples going to use much more exciting examples relating... [Read more...]
1 2 3

Never miss an update!
Subscribe to R-bloggers to receive
e-mails with the latest R posts.
(You will not see this message again.)

Click here to close (This popup will not appear again)