
Analyze your Google+ Posts with R [Update]
Want to share your content on R-bloggers? click here if you have a blog, or here if you don't.

Hey everybody,
today I show you how you can start working with the Google+ API and R. We create a personal API key, get our own stats and plot them in a nice looking graph.
Get the API Key
You can get our API key on the Google Developer console here: https://code.google.com/apis/console
There you can see an overview of you API activities if you have some. To create a new API connection click on “APIs” and turn on the Google+ API.
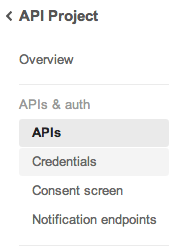
![]()
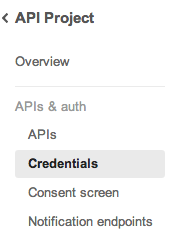
After you did this, you can click on “Google+” and you see a list of the available API calls. Now click on “Credentials” on the left and click on “Create new key” to create a new public API access. Then click on “Browser key” and then “Create”.

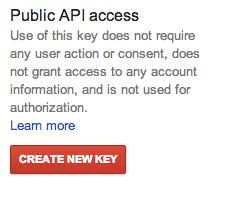

And there it is: you API key.
The R Part
For our first analysis we need the packages
library(RCurl);

library(RJSONIO);
And we need our api key and our user id:
api_key<-"XXX"

user_id <- "105616015219357887822"
In this case I used my own Google+ ID but you can use every ID you want. But we can just receive the public posts.
We get our raw data and put it in a JSON object with:
data <- getURL(paste("https://www.googleapis.com/plus/v1/people/",user_id,"/activities/public?maxResults=100&key=", api_key, sep=""),ssl.verifypeer = FALSE)

js <- fromJSON(data, asText=TRUE);
We can now put the data in a DataFrame to make it more readable. But we don´t need all the values we received as these are a lot. We get the fields
![]()
df = data.frame(no = 1:length(js$items))

for (i in 1:nrow(df)){

df$kind[i] = js$items[[i]]$verb

df$title[i] = js$items[[i]]$title

df$replies[i] = js$items[[i]]$object$replies$totalItems

df$plusones[i] = js$items[[i]]$object$plusoners$totalItems

df$reshares[i] = js$items[[i]]$object$resharers$totalItems

df$url[i] = js$items[[i]]$object$url

}
We can save this DataFrame as a CSV file with:
filename <- paste("gplus_data_", user_id, sep="") # in case we have more user_ids


write.table(df, file = paste0(filename,".csv"), sep = ",", col.names = NA,
 qmethod = "double")
Visualize your Posts
To visualize your posts we extract the informations we need and store them in the Data Frame df_graph
df_graph = df[,c(1,4,5,6)]
Then we can plot it with
require(ggplot2)

require(reshape2)

melted=melt(df_graph,id.vars='no')

ggplot(melted,aes(x=factor(no),y=value,color=factor(variable),group=factor(variable)))+
 geom_line()+xlab('no')+guides(color=guide_legend("metrics"))+
 labs(title="Google+")

You can find the complete code on my github page here.
Please follow me on Twitter to stay up to date.

R-bloggers.com offers daily e-mail updates about R news and tutorials about learning R and many other topics. Click here if you're looking to post or find an R/data-science job.
Want to share your content on R-bloggers? click here if you have a blog, or here if you don't.