
4 reasons to compute importance using Relative Weights rather than Shapley Regression
Want to share your content on R-bloggers? click here if you have a blog, or here if you don't.

Shapley regression is a popular method for estimating the importance of predictor variables in linear regression. This method can deal with highly correlated predictor variables that are frequently encountered in real-world data. Shapley regression has been gaining popularity in recent years and has been (re-)invented multiple times1Lipovetsky, S. and Conklin, M. (2001). Analysis of regression in game theory approach. Appl. Stochastic Models Bus. Ind., 17: 319–330.2Lindeman, R.H., Merenda, P.F. and Gold, R.Z. (1980). Introduction to Bivariate and Multivariate Analysis, Scott, Foresman, Glenview IL.3Budescu, D.V. (1993). Dominance analysis: a new approach to the problem of relative importance in multiple regression. Psychol Bull 114:542-551. under various names such as dominance analysis or LMG. In this blog post, I explain why a newer method, relative weights4Johnson, J.W. (2000). A heuristic method for estimating the relative weight of predictor variables in multiple regression. Multivariate behavioral research 35, 1-19., should be used instead of Shapley regression.
Both methods give essentially equivalent results
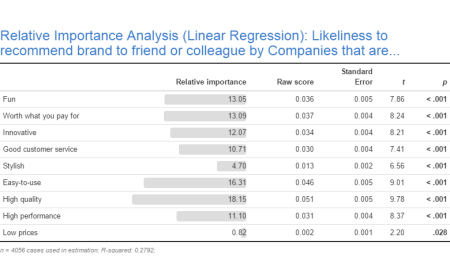
The table below shows a typical example of the results from Shapley versus Relative Weights. The correlation between the two sets of scores is greater than 0.99. This is the norm, rather than a fluke5LeBreton, J.M., Ployhart, R.E. and Ladd, R.T. (2004). A Monte Carlo Comparison of Relative Importance Methodologies. Organizational Research Methods 7, 258 – 282.6Grömping, U. (2015). Variable importance in regression models, WIREs Comput Stat 7, 137-152.. It is not obvious from the maths how the two metrics are so similar, but they are. In fact, for models with two predictors, the two metrics have been proven to be identical7Thomas, D.R., Zumbo B.D., Kwan E., Schweitzer L. (2014). On Johnson’s (2000) Relative Weights Method for Assessing Variable Importance: A Reanalysis. Multivariate behavioral research 49, 329-338..
| Shapley | Relative Importance Analysis | |
|---|---|---|
| Fun | .035 | .036 |
| Worth what you pay for | .036 | .037 |
| Innovative | .034 | .034 |
| Good customer service | .029 | .030 |
| Stylish | .015 | .013 |
| Easy-to-use | .045 | .046 |
| High quality | .051 | .051 |
| High performance | .032 | .031 |
| Low prices | .002 | .002 |
For a more thorough analysis of the differences between Shapley and Relative Importance Analysis, please see this blog post.
1. Relative Weights are much faster to compute
The main problem with Shapley regression is that the computational resources required to run an analysis grows exponentially with the number of predictor variables. Shapley has become accessible in recent years due to the rapid increase in computing power, allowing models with less than 15 variables to be computed within seconds. However, with each additional variable, the time required more than doubles. A model with 30 variables would take days to run on a decent desktop computer. While the time required to run Relative Importance Analysis also increases with the number of predictor variables, it does not do so exponentially. Consequently, a 30 variable model will run almost instantly on a modern computer.
The difference in computational time merits our concern. A model that takes hours or days to run only gets run once, or at most a few times. On the other hand, a model that can be run quickly, inevitably gets more carefully scrutinized. Such additional scrutiny makes it practical to see how changes in the model impact results.
2. Relative Weights allows you to use as many variables as you want
The exponential growth in the time needed to run Shapley regression places a constraint on the number of predictor variables that can be included in a model. While the limit on the number of variables will vary based on your patience and computing resources, eventually adding more variables inevitably becomes unfeasible. The negligible computation time of Relative Importance Analysis for all model sizes that a researcher might sensibly consider, avoids the necessity of limiting the model size due to computational constraints.
3. Estimating significance without bootstrapping
You obtain the statistical significance of Shapley regression scores by running the method on bootstrapped data. This increases the time needed many times over, than when running a single model. In the case of Shapley, an already slow method becomes even slower. Relative Weights is also amenable to bootstrapping, which will not be as computationally expensive as it is for Shapley. However, with Relative Weights, significance can be estimated without bootstrapping because an expression for their standard errors can be developed. Standard errors allow us to test whether the scores are significantly different from zero, which is a way of determining if predictor variables are contributing to the model.
4. Computing importance for other types of regression models
The derivation of Shapley regression relies on R2, which indicates the proportion of variance in the outcome variable explained by the model. Other types of generalized linear models (GLMs), such as logistic and Poisson regression, have no equivalent to R2. While you can jerry-rig pseudo-R2 statistics, an even bigger problem looms. Most GLMs take much, much, longer to compute than linear regression. This means that the time taken increases, reducing the possible number of variables to include.
Computing Relative Weights in R
The flipRegression package on GitHub contains an R function called Regression. This function refers to Relative Weights as Relative Importance to distinguish it from sampling weights (also supported by the package). Referring to two different things as “weights” could otherwise result in confusion! The following code estimates the Relative Weights for a linear regression model.
library(flipRegression)
glm <- Regression(Q3 ~ Q4A + Q4B + Q4C + Q4D + Q4E + Q4F + Q4G + Q4H + Q4I,
output = "Relative Importance Analysis")
The code below estimates the Relative Weights using an ordered logit model with sampling weights:
library(flipRegression)
glm <- Regression(Q3 ~ Q4A + Q4B + Q4C + Q4D + Q4E + Q4F + Q4G + Q4H + Q4I,
weights = wgt, type = "Ordered Logit", output = "Relative Importance Analysis")
A Displayr document contains the relevant code from this example. There you can explore it in a point-and-click environment. Click here to go to the setup screen for Displayr, after which you will be taken to the document containing the example described in this blog post. You can also upload different data sets if you wish. Additionally, you can access and manipulate the underlying R code if you like – click on the output of the analysis, and select Properties > R CODE.
Acknowledgements
The outputs shown above use formattable.
References
| 1. | ↑ | Lipovetsky, S. and Conklin, M. (2001). Analysis of regression in game theory approach. Appl. Stochastic Models Bus. Ind., 17: 319–330. |
| 2. | ↑ | Lindeman, R.H., Merenda, P.F. and Gold, R.Z. (1980). Introduction to Bivariate and Multivariate Analysis, Scott, Foresman, Glenview IL. |
| 3. | ↑ | Budescu, D.V. (1993). Dominance analysis: a new approach to the problem of relative importance in multiple regression. Psychol Bull 114:542-551. |
| 4. | ↑ | Johnson, J.W. (2000). A heuristic method for estimating the relative weight of predictor variables in multiple regression. Multivariate behavioral research 35, 1-19. |
| 5. | ↑ | LeBreton, J.M., Ployhart, R.E. and Ladd, R.T. (2004). A Monte Carlo Comparison of Relative Importance Methodologies. Organizational Research Methods 7, 258 – 282. |
| 6. | ↑ | Grömping, U. (2015). Variable importance in regression models, WIREs Comput Stat 7, 137-152. |
| 7. | ↑ | Thomas, D.R., Zumbo B.D., Kwan E., Schweitzer L. (2014). On Johnson’s (2000) Relative Weights Method for Assessing Variable Importance: A Reanalysis. Multivariate behavioral research 49, 329-338. |
R-bloggers.com offers daily e-mail updates about R news and tutorials about learning R and many other topics. Click here if you're looking to post or find an R/data-science job.
Want to share your content on R-bloggers? click here if you have a blog, or here if you don't.