
August 2025 Top 40 New CRAN Packages
Want to share your content on R-bloggers? click here if you have a blog, or here if you don't.
Causal Inference
gadjid v0.1.0: Enables efficient Rust implementations of graph adjustment identification distances available in R. These distances (based on ancestor, optimal, and parent adjustment) count how often the respective adjustment identification strategy leads to causal inferences that are incorrect relative to a ground-truth graph when applied to a candidate graph instead. See Henckel, Würtzen, Weichwald (2024) for background and README to get started.
Data
datacommons v0.1.0: Implements a wrapper to the Google Data Commons API V2 that provides programmatic access to statistical and demographic data from dozens of sources organized in a knowledge graph. See the vignette.
imfweo v0.1.0: Provides tools to download, process, and analyze data from the International Monetary Fund’s World Economic Outlook (WEO) database, including functions for downloading complete WEO releases, accessing specific economic indicators for selected countries, and listing available data. See README.
letsRept v1.0.1: Provides tools to retrieve and summarize taxonomic information and synonymy data for reptile species using data scraped from The Reptile Database website. See the vignette.
pubchem.bio v1.0.1: Provides functions to parse the biologically relevant compounds from all PubChem compounds, using biological database sources, pathway presence, and taxonomic relationships. See the vignette.
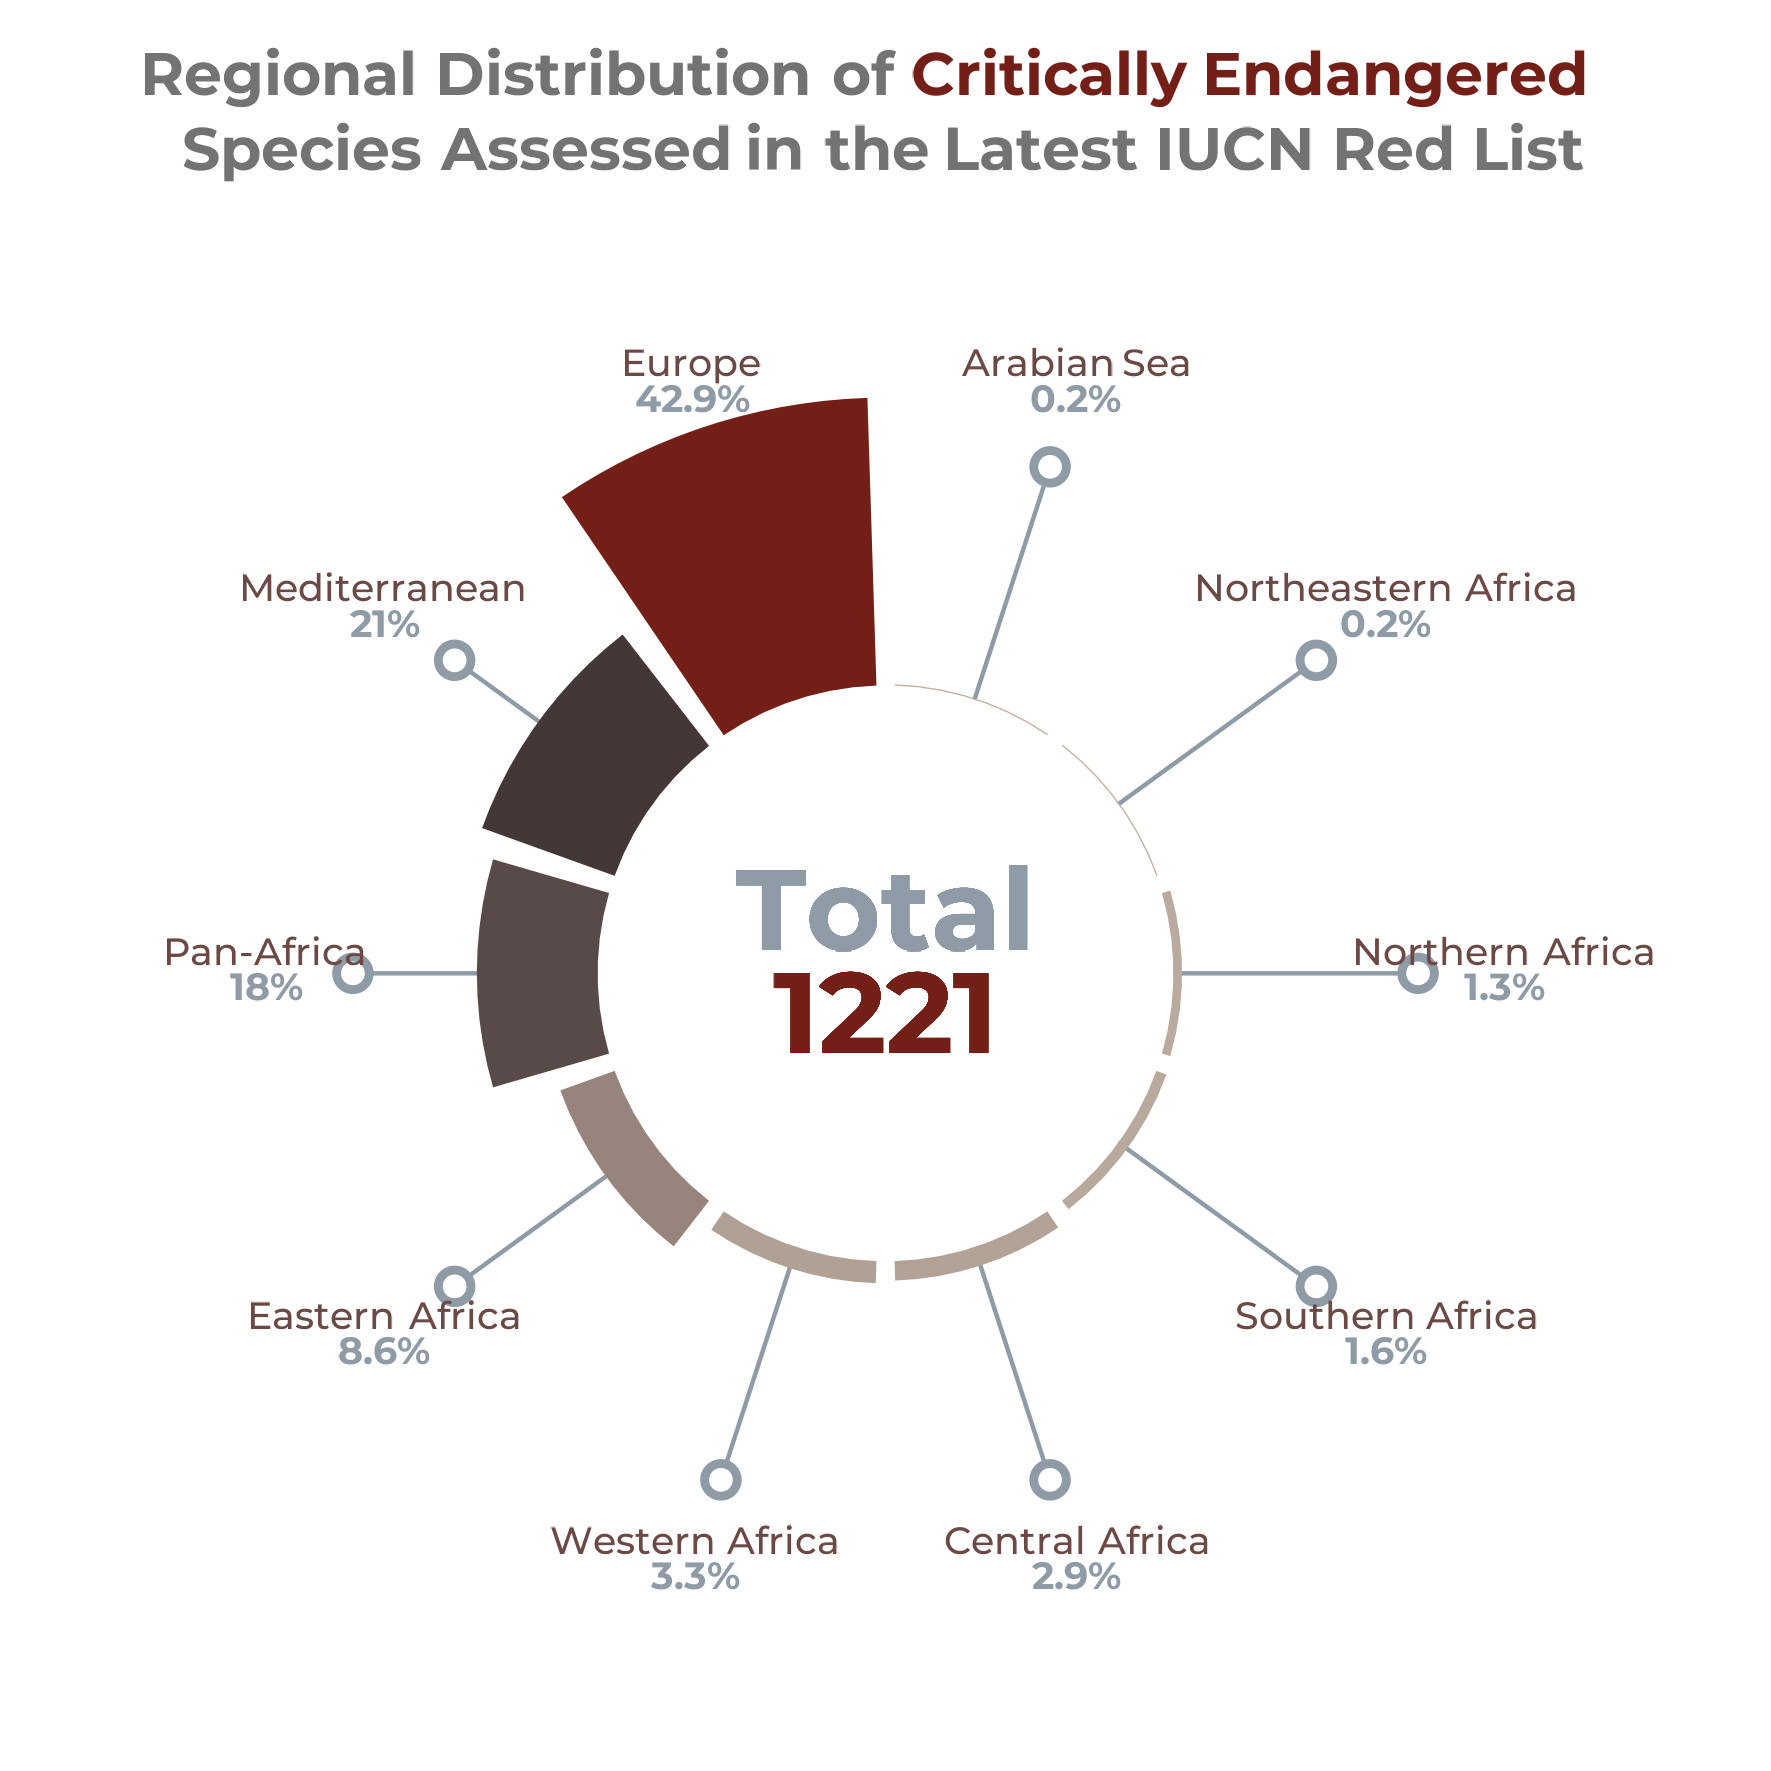
redlist v0.2.0: Provides an interface to access data from the International Union for Conservation of Nature (IUCN) Red List, allowing users to retrieve up-to-date information on species’ conservation status in support of biodiversity research and conservation efforts. There is an Introduction and a vignette on Visualization.
verdadecu v1.0.0: Provides access to data collected by the Ecuadorian Truth Commission, including datasets documenting human rights violations from 1984-2008, containing victim information, violation types, perpetrators, and geographic distribution. See the vignette.
Differential Privacy
GRANDpriv v0.1.3: Implements a novel method for privatizing network data using differential privacy and includes functions for generating synthetic networks based on a latent space model, applying differential privacy to network latent positions, and evaluating the utility of privatized networks. See Liu, Bi, & Li (2025) for details and README for examples.
Ecology
ecodive v2.0.0: Provides functions to compute alpha and beta diversity metrics using concurrent C threads. Metrics include UniFrac, Faith’s phylogenetic diversity, Bray-Curtis dissimilarity, Shannon diversity index. Functions also parse newick trees into phylo objects and rarefy feature tables. There are six vignettes, including an Introduction and Selecting a Beta Diversity Metric.

Environmental Studies
ffaframework v0.1.1: Implements the the FFA framework proposed by Vidrio- Sahagún et al. (2024) to support systematic and reproducible workflows for both stationary and nonstationary flood frequency analysis, with applications extending to other hydroclimate extremes, such as precipitation frequency analysis. There are six vignettes, including Change Point Detection and Notstationary FFA.

Epidemiology
mlspatial v0.1.0: Provides tools for the integration, visualization, and modelling of spatial epidemiological data using the method described in Azeez & Noel (2025). Users can import and pre-process shapefiles and associated demographic or disease incidence data, generate richly annotated thematic maps, and apply predictive models to identify spatial patterns and risk factors. See the vignette.

Geology
stratcols v1.0.0: Provides tools to quantify stratigraphic disorder using the metrics defined by Burgess (2016), including a range of utility tools to construct and manipulate stratigraphic columns. There are three vignettes, including an Introduction and Quantifying stratigraphic order.
Genetics
tidypopgen v0.3.2: Provide a tidy grammar of population genetics, facilitating the manipulation and analysis of data on biallelic single nucleotide polymorphisms (SNPs). Functions scale to very large genetic datasets by storing genotypes on disk, and performing operations on them in chunks, without ever loading all data in memory. See Carter et al. (2025) for details. There are five vignettes, including an Introduction and The grammar of population genetics.

Genomics
ibdfindr v0.3.1: Implements continuous-time hidden Markov models (HMMs) to infer identity-by-descent (IBD) segments shared by two individuals from their single-nucleotide polymorphism (SNP) genotypes. Provides posterior probabilities at each marker (forward-backward algorithm), prediction of IBD segments (Viterbi algorithm), and functions for visualizing results. Supports both autosomal data and X-chromosomal data. See README for examples.

readyomics v0.1.2: Provides a flexible and streamlined pipeline for formatting, analyzing, and visualizing omics data (e.g., transcriptomics, proteomics, metabolomics) and includes tools for shaping input data, fitting linear or mixed-effect models, extracting key contrasts, and generating publication-quality plots. See the vignette.

Health Technology Assessment
searchAnalyzeR v0.1.0: Provides comprehensive analytics, reporting, and testing capabilities for systematic review search strategies, focusing on validating search performance, generating standardized PRISMA-compliant reports, and ensuring reproducibility in evidence synthesis. Features include precision-recall analysis, cross-database performance comparison, benchmark validation against gold standards, sensitivity analysis, temporal coverage assessment, automated report generation, and statistical comparison of search strategies. See the vignettes Comparing Search strategies and Real PubMed Search Analysis.

Machine Learning
LCCkNN v0.1.0: Implements the kK-NN algorithm, an adaptive k-nearest neighbor classifier that adjusts the neighborhood size based on local data curvature. The method estimates local Gaussian curvature by approximating the shape operator of the data manifold. This approach aims to improve classification performance, particularly in datasets with limited samples. Look here for examples.
Medical Statistics
E2E v0.1.0: Provides a framework to build and evaluate diagnosis or prognosis models using stacking, voting, and bagging ensemble techniques with various base learners. There are five vignettes, including Getting Started and Advanced Features & Customization.
kfre v0.0.2: Implements the Kidney Failure Risk Equation Tangri et al. (2011) and Tangri et al. (2016) to compute two and five year kidney failure risk. Includes helper functions to classify chronic kidney disease (CKD) stages and end-stage renal disease (ESRD) outcomes, and evaluate and plot model performance. See the [vignette]https://cran.r-project.org/web/packages/kfre/vignettes/getting-started.html) to get started.
metaSVR v0.1.0: Provides a hybrid modeling framework combining Support Vector Regression with metaheuristic optimization algorithms, including the [Archimedes Optimization Algorithm], Hashim et al. (2021); Coot Bird Optimization, Naruei & Keynia (2021); as well as several others. Functions enable automatic tuning of SVR hyperparameters (cost, gamma, and epsilon) to enhance prediction performance. See Setiawan et al. (2021) and Liu et al. (2018) for implementation details and README for an example.
Statistics
AdapDiscom v1.0.0: Implements adaptive direct sparse regression for high-dimensional multimodal data with heterogeneous missing patterns and measurement errors. The method supports flexible block configurations and includes robust variants for heavy-tailed distributions and fast implementations for large-scale applications. See Diakité et al. (2025) for background and the vignette to get started.
allocation v0.1.0: Implements several exact methods for allocating optimal sample sizes when designing stratified samples. These methods are discussed in Wright (2012) and Wright (2017). See the vignette.
BSTFA v0.1.0: Implements Bayesian spatio-temporal factor analysis models for multivariate data observed across space and time. The package provides MCMC tools for model fitting, spatial and temporal interpolation, and visualization of latent factors and loadings. See Berrett et al. (2020) and the vignette for examples.

calms v1.0-1: Provides a Shiny application to conduct comprehensive analysis of latent means including the examination of group equivalency, propensity score analysis, measurement in variance analysis, and assessment of latent mean differences of equivalent groups with invariant data. Ho et al. (2011), Rosseel (2012), and Hammack-Brown et al. (2021) for background and the vignette for examples.

CCI v0.3.4: Implements a tool for performing computational testing for conditional independence between variables in a dataset by using permutations in combination with Monte Carlo cross-validation to generate null distributions and test statistics. See Thorjussen et al. (2024) for details and README for examples.
ExactVaRTest v0.1.3: Provides fast dynamic-programming algorithms in C++/Rcpp for the exact finite-sample distributions and p-values of Christoffersen (1998) independence and conditional-coverage VaR back tests. For completeness, it also provides the exact unconditional-coverage test following Kupiec (1995) via a closed-form binomial enumeration. See the vignette.
propertee v1.0.1: Provides functions to facilitate direct adjustment for experiments and observational studies that are compatible with a range of study designs and covariance adjustment strategies. Functions use explicit specification of clusters, blocks, and treatment allocations to furnish probability of assignment-based weights targeting any of several average treatment effect parameters. There are three vignettes, including Introduction and Regression Discontinuity Design.
senseweight v0.0.1: Provides tools to conduct interpretable sensitivity analyses for weighted estimators to evaluate the sensitivity of the underlying weighting estimators to omitted moderators or confounders. See Huang (2024) and Hartman and Huang (2024) for background. There are two vignettes External Validity and Survey.

WData v0.1.0: Provides functions to estimate the density and cumulative distribution functions from biased samples of continuous distributions. Includes the estimators proposed by Bhattacharyya et al. (1988) and Jones (1991) for density, and Bose and Dutta (2022) for distributions. See README for examples.

Surveys
CATAcode v1.0.0: Provides tools to assist with data transformations and subjective decisions often required on “check-all-that-apply” surveys. Includes functions for exploring response patterns, data transformations, applying a set of decision rules for coding responses, and summarizing response frequencies. See the vignette.
Time Series
dsp v1.2.0: Provides efficient MCMC algorithms for dynamic shrinkage processes, which extend global-local shrinkage priors to the time series setting by allowing shrinkage to depend on its own past. These priors yield locally adaptive estimates, useful for time series and regression functions with irregular features. See Kowal et al. (2019), Wu et al. (2024), and Cho and Matteson (2024) for background on the methods implemented and README to get started.
unfold v1.0.0: Implements an algorithm that reframes time series forecasting as a geometric learning problem through variational mapping that expands future temporal dynamics from folded high-dimensional geometric distance spaces. It turns time series into a 4D block of pairwise distances between reframed windows and maps those distances to the next reframed window to produce predictive functions. Look here for the details.

Toxicology
invitroTKstats v0.0.13: Provides tools for processing and analyzing in vitro toxicokinetic measurements in a standardized and reproducible pipeline. Functions perform frequentist and Bayesian estimation on a variety of in vitro toxicokinetic measurements, including chemical fraction unbound in the presence of plasma (f_up), intrinsic hepatic clearance (Clint, uL/min/million hepatocytes), and membrane permeability for oral absorption (Caco2). See Wambaugh et al. (2019) for background. There are seven vignettes, including Data Guide and Clint.

Utilities
CBTF v0.5.0: Provides simple runner (the mechanism responsible for executing the fuzzing process) for fuzz-testing functions in an R package’s public interface. Fuzz testing helps identify functions lacking sufficient argument validation, and uncovers problematic inputs that, while valid by function signature, may cause issues within the function body. See README for examples.
multideploy v0.1.1: Provides tools to deploy file changes across multiple GitHub repositories using the GitHub Web API, allow synchronizing common files, and continuous Integration workflows. See the vignette.
Visualization
ggdiagram v0.1.1: Provides object oriented functions to create diagrams with geometric objects that have computed properties with information about themselves (e.g., their area) or about their relationships with other objects (e.g, the distance between their edges). See the vignette.

ggdiceplot v0.1.0: Provides ggplot2 extensions, including geom_dice() for creating dice-based visualizations where each dot position represents a specific categorical variable. Look here for examples.

gridify v0.7.4: Implements a tool to create enriched figures and tables by providing a way to add text around them through predefined or custom layouts. Any input such as ggplot, gt, or flextable which is convertible to grob. Functions are based grid graphics. See Murrell (2018) for details. There are five vignettes, including Get Started and Multi-Page and Multi-Figure Examples.

terminalgraphics v0.1.1: Defines a graphics device and functions for graphical output in terminal emulators that support graphical output. Currently supports the Terminal Graphics Protocol and Sixel. Look here for examples.

TheseusPlot v0.1.1: Provides tools for decomposing and visualizing differences in rate metrics between two groups into contributions from individual subgroups. A Theseus plot combines the stepwise progression of a waterfall plot with the comparative bars of a bar chart, offering an intuitive way to understand subgroup-level effects. See README for examples.

R-bloggers.com offers daily e-mail updates about R news and tutorials about learning R and many other topics. Click here if you're looking to post or find an R/data-science job.
Want to share your content on R-bloggers? click here if you have a blog, or here if you don't.