
Computing dynamic economic models in R for dummies: using deSolve to get qualitative solutions to Euler equations.
Want to share your content on R-bloggers? click here if you have a blog, or here if you don't.
Note: A video explaining the content of this blog can be found here
The computation of macroeconomic models is one which both fascinates and mystifies new students and scholars in this field. It certainly was a topic which seemed completely inaccessible to me without an advanced knowledge of algorithms and computational expertise.
On an outset this new requisite skill required in the computation of these models seem odd. On paper (and often in many textbooks) we say a we have solved a model if the Euler equation has been successfully identified. Once we do this we can successfully trace an optimal path of consumption based on how we have defined consumption at time zero. This is exactly what is done when we qualitatively solve an ordinary differential equation. So as a start lets first work with that.
This approach of tracing Euler equations is useful as we can visualize possible consumption paths and more importantly, can examine the impact of sudden parameter shocks on these paths and illustrate what comparative statics look like when time is involved in our models.
The Math
We consider the following intertemporal euler equation in our exercise here.
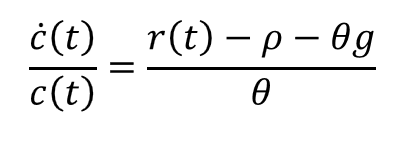
This Euler equation is the solution to a Ramsey Cass Koopmans model (which you can see derived in a series of YouTube videos I have made here). This equation states that if our households are consuming optimally at t=0 then the subsequent consumption that follows is governed by this equation.
This is a powerful result, stating we can define a series of optimums based on knowledge of household consumption now.
To use this result we rearrange this equation into a form that we can iterate on with ease, this being:

This above equation we can trace our consumption paths considering an each value of consumption at time t. Picking a value for what c(0) is we can get a sense of what this path looks like and how it can change with different parameter values.
Computing Optimal Paths in R
The code which we will consider for plotting two different paths will be as given below. Some things worth noting are:
•Define the parameters of our model along with our state space as given by our time index which is represented by a sequence.
• that when we define cdot and cdot1 we need to define them as functions of t our state variable and parms. we dont use parms in our code but its necessary for being used in the ode() function.
• The ode() function requires specification of your starting state, time index and functions which are intended as ODEs.
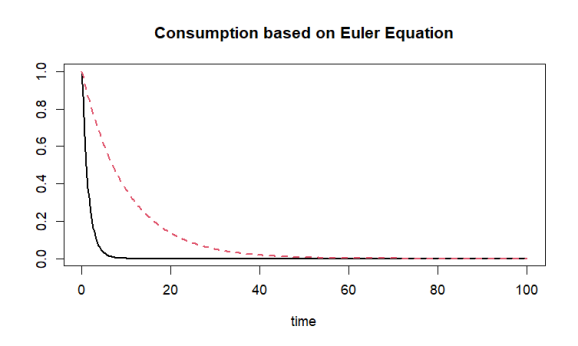
• Our principle purpose of computing these Euler equations is to illustrate the comparative statics of the Euler equation which can be difficult to understand on paper as such if you are considering multiple types of shocks you should consider each grouped in pairs.
With all this in mind we end up with the code below:
library('deSolve')


#parameters and state space
r<-1
rho<-0.9
rho1<-0.6
theta<-0.5
g<-0.9
coninital <- c(con = 1)
times <- seq(from = 0, to = 100, by = 0.2)

#define euler equation
cdot <- function(t, con, parms){
  list((((r-rho)/theta)-g)*con)}

cdot1<-function(t,con,prams){
  list((((r-rho1)/theta)-g)*con)
}
#Compute
out <- ode(y = coninital, times = times, func = cdot,
           parms = NULL)
out1<-ode(y = coninital, times = times, func = cdot1,
          parms = NULL)
plot(out,out1, main = "Consumption based on Euler Equation", lwd = 2)
Conclusion
Computational economics is hard. Very hard. But if your purpose is to illustrate some comparative statics through the Euler equation, fortunately some basic knowledge of qualitative solutions to ODEs can take you a long way.
R-bloggers.com offers daily e-mail updates about R news and tutorials about learning R and many other topics. Click here if you're looking to post or find an R/data-science job.
Want to share your content on R-bloggers? click here if you have a blog, or here if you don't.