
FPL – Point Project Part 3
Want to share your content on R-bloggers? click here if you have a blog, or here if you don't.
Hello, this is part 3 of building a model to project the points a player might score in a given game week. If you have not read part 1 or 2 links below
Part 1 – https://theparttimeanalyst.com/2021/03/09/building-a-model-in-r-to-predict-fpl-points/
Part 2 – https://theparttimeanalyst.com/2021/04/22/fpl-point-projection-in-r-part-2/
Now that the estimate of the score is created its time to work out what each players impact is. Below is a summary of the current scoring in the fantasy premier league

Most of the points are in 4 areas minutes played, goals scored, assists and goals conceded. The points are also different for the different positions a player might play so that will have to be taken into account
Goals Scored Points
First part is to predict the amount of goals a player might score. I decided that player level xG90 is the best metric to use and is readily available for the model. My particular source is the understat R package. This links directly to the understat website and allows the download of by player expected goal data
## this code downloads the whole xg data for 2019
twenty19 <- get_team_players_stats(team_name = "Arsenal" ,year = 2019) %>%
    bind_rows(get_team_players_stats(team_name = "Bournemouth" ,year = 2019)) %>%
    bind_rows(get_team_players_stats(team_name = "Burnley" ,year = 2019)) %>%
    bind_rows(get_team_players_stats(team_name = "Chelsea" ,year = 2019)) %>%
    bind_rows(get_team_players_stats(team_name = "Crystal Palace" ,year = 2019)) %>%
    bind_rows(get_team_players_stats(team_name = "Everton" ,year = 2019)) %>%
    bind_rows(get_team_players_stats(team_name = "Newcastle United" ,year = 2019)) %>%
    bind_rows(get_team_players_stats(team_name = "Leicester" ,year = 2019)) %>%
    bind_rows(get_team_players_stats(team_name = "Liverpool" ,year = 2019)) %>%
    bind_rows(get_team_players_stats(team_name = "Manchester City" ,year = 2019)) %>%
    bind_rows(get_team_players_stats(team_name = "Manchester United" ,year = 2019)) %>%
    bind_rows(get_team_players_stats(team_name = "Sheffield United" ,year = 2019)) %>%
    bind_rows(get_team_players_stats(team_name = "Southampton" ,year = 2019)) %>%
    bind_rows(get_team_players_stats(team_name = "Norwich" ,year = 2019)) %>%
    bind_rows(get_team_players_stats(team_name = "Brighton" ,year = 2019)) %>%
    bind_rows(get_team_players_stats(team_name = "Aston Villa" ,year = 2019)) %>%
    bind_rows(get_team_players_stats(team_name = "Tottenham" ,year = 2019)) %>%
    bind_rows(get_team_players_stats(team_name = "Watford" ,year = 2019)) %>%
    bind_rows(get_team_players_stats(team_name = "Wolverhampton Wanderers" ,year = 2019)) %>%
    bind_rows(get_team_players_stats(team_name = "West Ham" ,year = 2019))
I downloaded the data for 2017 and 2918 as well and then calculated each players overall xg90 as I think that will vary a lot therefore I am using the players xg90 over all the data. Therefore for this part of the model I will use the goals the team are predicted to score and the players xg90 with the thought being that if the players team was only to score one goal in the match the player wit the highest xG ratIng will be the ones most likely to score the goal.
## As always im using the tidymodels suite of packages and fitting a simpe random forest

goals_split <- initial_split(goals, prop = 0.8, strata = goals_scored)
goals_train <- training(goals_split)
goals_test <- testing(goals_split)
goal_for <- rand_forest() %>%
                set_mode("classification") %>%
                set_engine("ranger") %>%
                  fit(goals_scored ~ ., goals_train)
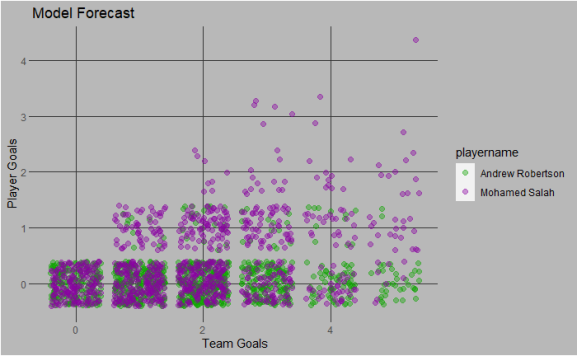
Now I have a model that gives a prediction of how many goals a player might score. All I have to do is apply the model to the 10000 runs of the match for each player and it will have whether the player scored or not and if they scored ore then 1. Running the goal prediction model to for one match over 10000 times gives to following results for 2 Liverpool players
Assists Points
Calculating assists points is pretty similar to goal scored points. Its a separate model that uses the estimate how many goals the players team will score and then the players xA per 90. The code is exactly the same as the code used for the goal expectation just with the new data for xA used instead of expected goals.
Minutes played points
This part of the point prediction is a relatively low amount of points available but is needed because the chance of a player playing is important as you want to maximise your team in getting the most amount of minutes possible.
## got each players last 5 matches average minutes played using the rollmean function from the zoo package then put it into a category if the player went onto play more then  60 minutes

s16min <- season16 %>% group_by(playername) %>%
                              mutate(rollmin = zoo::rollmean(minutes, 5, fill = NA)) %>%
                              mutate(mins = if_else(minutes > 60, ">60", "<60")) %>%
                                ungroup() %>%
                                select(mins, rollmin)


s17min <- season17 %>% group_by(playername) %>%
                              mutate(rollmin = zoo::rollmean(minutes, 5, fill = NA)) %>%
                              mutate(mins = if_else(minutes > 60, ">60", "<60")) %>%
                                ungroup() %>%
                                select(mins, rollmin)


s18min <- season18 %>% group_by(playername) %>%
                              mutate(rollmin = zoo::rollmean(minutes, 5, fill = NA)) %>%
                              mutate(mins = if_else(minutes > 60, ">60", "<60")) %>%
                                ungroup() %>%
                                select(mins, rollmin)


min_dat <- s16min %>% bind_rows(s17min) %>%
                              bind_rows(s18min) %>%
                                  filter(!is.na(rollmin))

min_dat$mins <- as.factor(as.character(min_dat$mins))
Once the data to train the model on was created I then followed a similar formula to the assist points and the goals scored.
min_split <- initial_split(min_dat, prop = 0.9, strata = mins) # split the data regime


min_train <- training(min_split) ## training split

min_test <- testing(min_split) ## testing split


## fitted a logistic regression model as there are only 2 categoires
min_mod <- logistic_reg() %>%
                set_engine("glm") %>%
                        fit(mins ~. , min_train)
As there are only two categories whether the player is likely to play more then 60 minutes or not which is the key part for getting the minutes played points. This also impacts the points the player will receive for clean sheets and the model will only give the full points for clean sheets if they are predicted to play more then 60 minutes.

There’s the final model output for a random game week from 2019 comparing Mo Salah and Jordan Henderson. Obviously this game Salah is more then likely to score more points. It also looks more like the distribution of all the points.
Thats it for todays blog. Look out for part 4 which will look at the accuracy of the model. How it can be used while playing the game and the part 5 I will create a shiny tool to use to make decision making as easy as possible.
R-bloggers.com offers daily e-mail updates about R news and tutorials about learning R and many other topics. Click here if you're looking to post or find an R/data-science job.
Want to share your content on R-bloggers? click here if you have a blog, or here if you don't.